As Covid-19 continues to claim lives of hundreds and thousands, and affect many more, it has become a top priority for researchers worldwide to find answers and explanations regarding it. With epidemics and pandemics, research of various scope – from the medical and pharmacological to sociological and statistical – has been crucial in dealing with the deadly outbreaks.
Since the outbreak of Covid-19 began in Bangladesh in March 2020, professionals and researchers at Bengal Institute for Architecture, Landscape and Settlements have been working diligently in facing and tackling the crisis in multiple ways. Architects, geographers, illustrators and landscape architects at the Institute have devoted themselves to a variety of tasks – from building a sanitisation device and designing a safe market to creating a digital dashboard for tracking the spread of the coronavirus worldwide and awareness campaigns. Those tasks and projects were developed with the guidance of Kazi Khaleed Ashraf, Director General of the Institute, and Nusrat Sumaiya, Coordinator of the Research and Design Team.
Since 2015, and centered in Dhaka, Bangladesh, Bengal Institute has been dedicated to imagining a future Bangladesh through prospects of designed settlements and landscapes. Bengal Institute conducts research and design initiatives at regional and urban scales through multidisciplinary academic and research programs. With its various activities and programs, Bengal Institute has already become a leading organisation in rethinking the future of settlements and habitats.
In 1866, the working class neighbourhoods in the East End of London were suffering from one of the worst cholera outbreaks in the history of the city. At that time, due to the work done by a doctor and statistician named William Farr, Londoners were able to track the spread of cholera in the East End almost in real time. Based on John Snow’s hypothesis on the theory of cholera, the data Farr assembled was crucial in investigating and concluding how the people of that area had contracted cholera from the water supply.[1]
Fast forward to over 150 years later, we seem to be living in the middle of a similar epidemic, despite the massive advancements that have been made in the fields of science, medicine and technology since the Victorian era. The Covid-19 crisis continues to affect the entire world population, leaving its impact on everything from healthcare sectors to the global economy. With no vaccine or medicine available to fight the coronavirus as of yet, our only form of defense against the pandemic right now is the one Farr began developing over a century ago – collection and analysis of data.
As of 11th August, 2020, a total of 263,503 number of affected cases, 3471 deaths and 151,972 recovered cases have been recorded in Bangladesh.[2] With that in consideration, Bengal Institute has ventured into various initiatives which would help raise awareness, publish relevant data and provide protection against the spread of the global pandemic. Centering around data, maps and visualisations, the following coordinated Covid-19 responses were undertaken:
An Atlas of Covid-19
During the spread of the Covid-19, online-based visualisation platforms became an effective, near real-time medium to monitor the outbreak. In the midst of this, accurate and timely information regarding the pandemic is one of the essential factors needed for prevention. Data can help experts calculate the rate at which people are getting infected as well as locate hot spots accurately. In times of such crises, all these onslaughts of information can dispel uncertainties and give the general public enough data to compare different variables.
Bengal Institute’s Covid-19 Atlas is a window to both global and regional information on the novel coronavirus and related issues. First announced on 10th April, 2020, the Atlas comes with insightful data layers to explore global malaria parasites rates, BCG vaccination status, average temperature, precipitation, relative humidity, role of air-traffic, population density, air pollution etc., which can be overlaid on cumulative Covid-19 case bubbles. The Atlas can provide an initial level of understanding regarding the connection between transmission and fatality rate of the coronavirus with control of environment and hypothesised variables.
 Figure 1: Covid-19 Atlas showing cumulative confirmed cases worldwide, as of 20th August, 2020
“Mapping is an essential and primary medium for tackling any disastrous situation such as a health crisis, natural calamity, war etc,” says Mohammad Arfar Razi, one of the geographer team members at Bengal Institute involved with the Atlas. He and the team, with the guidance of Kazi Khaleed Ashraf, realised there was a scarcity of a geospatial platform that connected the fatality and transmission of the virus, and possible associations of the virus with the environment. Thus, following a continuous series of revelations and speculations, the necessity for an Atlas was felt by the team.
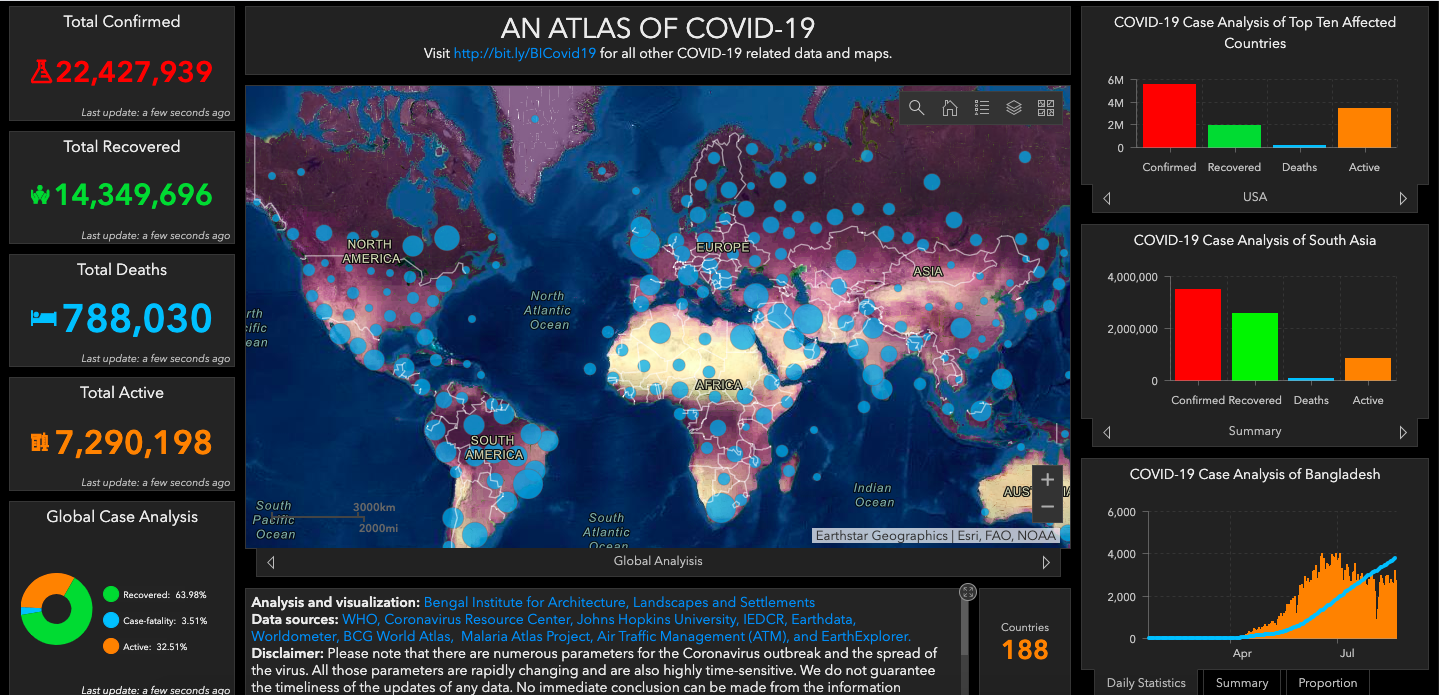 Figure 2: Covid-19 Atlas showing cumulative deaths worldwide, as of 20th August, 2020
But the purpose of the Atlas is not to just inform, but also to encourage more research. “The objective of the Atlas is to engage people of all sectors such as researchers, policy makers etc. in assumptions, hypotheses and conclusions on their own but based on some factual conditions in an interactive way,” says Razi.
The plan was to develop an operational dashboard by extracting data from repositories such as WHO, Johns Hopkins University, NASA EarthData etc, where layers of information can be represented in an interactive way, while taking into consideration some of the popular hypotheses published on Covid-19 cases. As Sanjoy Roy from the team describes, “We deployed geospatial techniques to pre-process those geospatial datasets, assigned specific geometry, classified to different ranges, and published using the Esri dashboard, a visualization platform to develop the Atlas.”
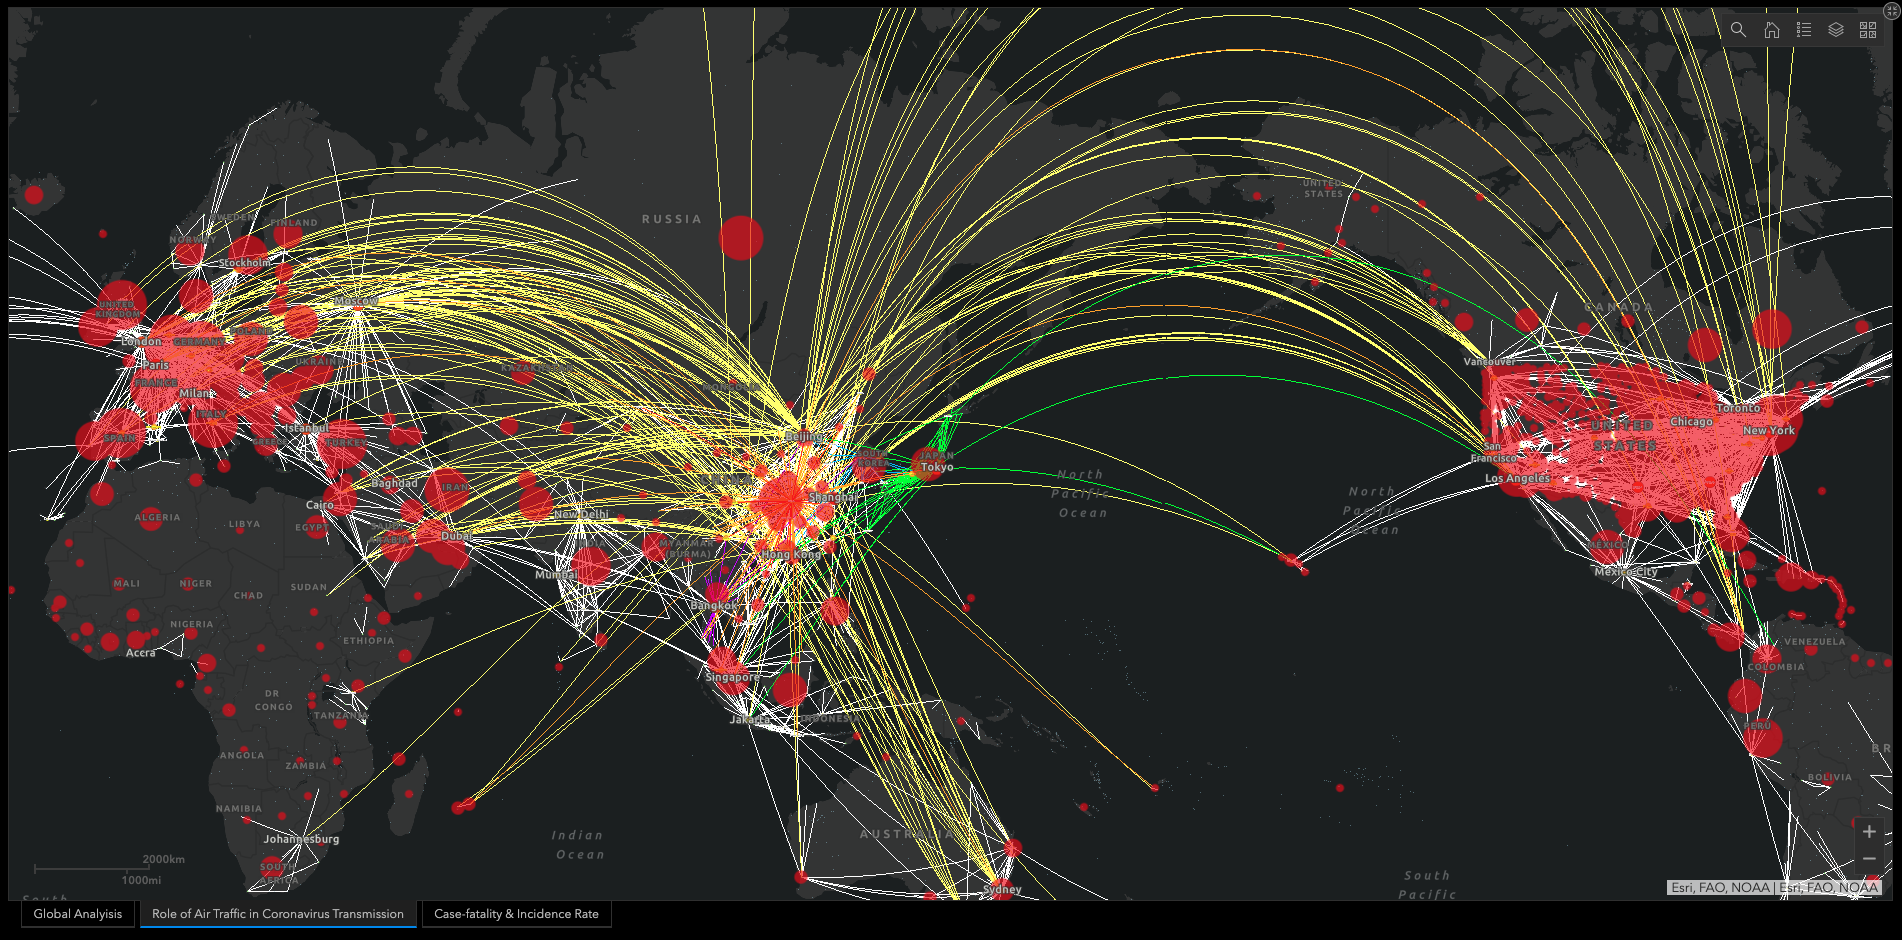 Figure 3: Covid-19 Atlas showing the role of air traffic in coronavirus transmission
However, the platform did not develop without some mishaps. “…several accidents happened during the process such as accidental deletion of the entire datasets, the WMS layers suddenly disappearing from the Atlas, etc,” says Sanjoy Roy. To prevent such incidents from happening again, the team has to keep an eye on every layer of the Atlas on a daily basis. “I’m checking the entire Atlas every day to see if any layers are switched off from the original sources. When it happens, I try to fix up by searching alternative sources of the muted WMS layer,” Roy adds.
 Figure 4: All the layers that are functioning in the Covid-19 Atlas
There are plans to add more layers like local-level cluster area, connectivity with nearest health centres, open spaces correlation with the confirmed cases, cases versus air pollution scenario etc. which could be helpful for taking preventive measures by analysing accurately on a local level. “Once the pandemic ends, this Atlas can continue to work as a reference point. For research purposes, it can work as a base data,” says Roy.
The Atlas has specific segments denoted to the spread of the coronavirus in the top ten affected countries, in South Asia and in Bangladesh. These sections show statistics regarding the number of affected cases, recovered cases and deaths with the help of bar charts and graphs.
As Razi further elaborates, “Indeed, we have plans to have a collaborative way of research among policy makers, doctors, public health researchers, data scientists, geo-spatial researchers and other experts; it is very much needed in tackling the unprecedented crisis we are in today.”
Daily Updates of Covid-19 Case Rate with Interactive Maps:
In the modern era of cartography, technology has played a tremendous role in supporting the creation, compiling and publishing of data in real time. For a public health crisis like Covid-19, it is of utmost importance to analyse and interpret data obtained from maps and visualisations. This is why, starting from 12th April, 2020, Bengal Institute took up the initiative to publish daily updates of case rates in Dhaka North, Dhaka South and overall in Bangladesh, with a population density layer on these maps following the official updates by the Institute of Epidemiology Disease Control And Research (IEDCR) every afternoon. After critically analysing their published data, the maps are created to understand the conditions throughout the country, with the help of country-level case rate and Dhaka neighbourhood case rate.
“Representing only the total cases can create confusion and cannot illustrate the density of the cases,” says Mohammad Arfar Razi, who was involved in making the case rate maps. And hence, Bengal Institute’s case rate maps are a representation of the Covid-19 cases with relation to the population. This relationship between the two variables can help to understand the density of occurrences of the Covid-19 at a neighbourhood or a district level.
One of the challenges of making the maps was collecting data, finding out where it is being sourced from and if that source is authentic. Assembling it and putting it in place requires a lot of work. If it’s not done right at the primary level, then it becomes difficult for others to follow through. So the team feels grateful to IECR for providing daily updates, thanks to which the data was assembled and restructured by the team at the Institute.
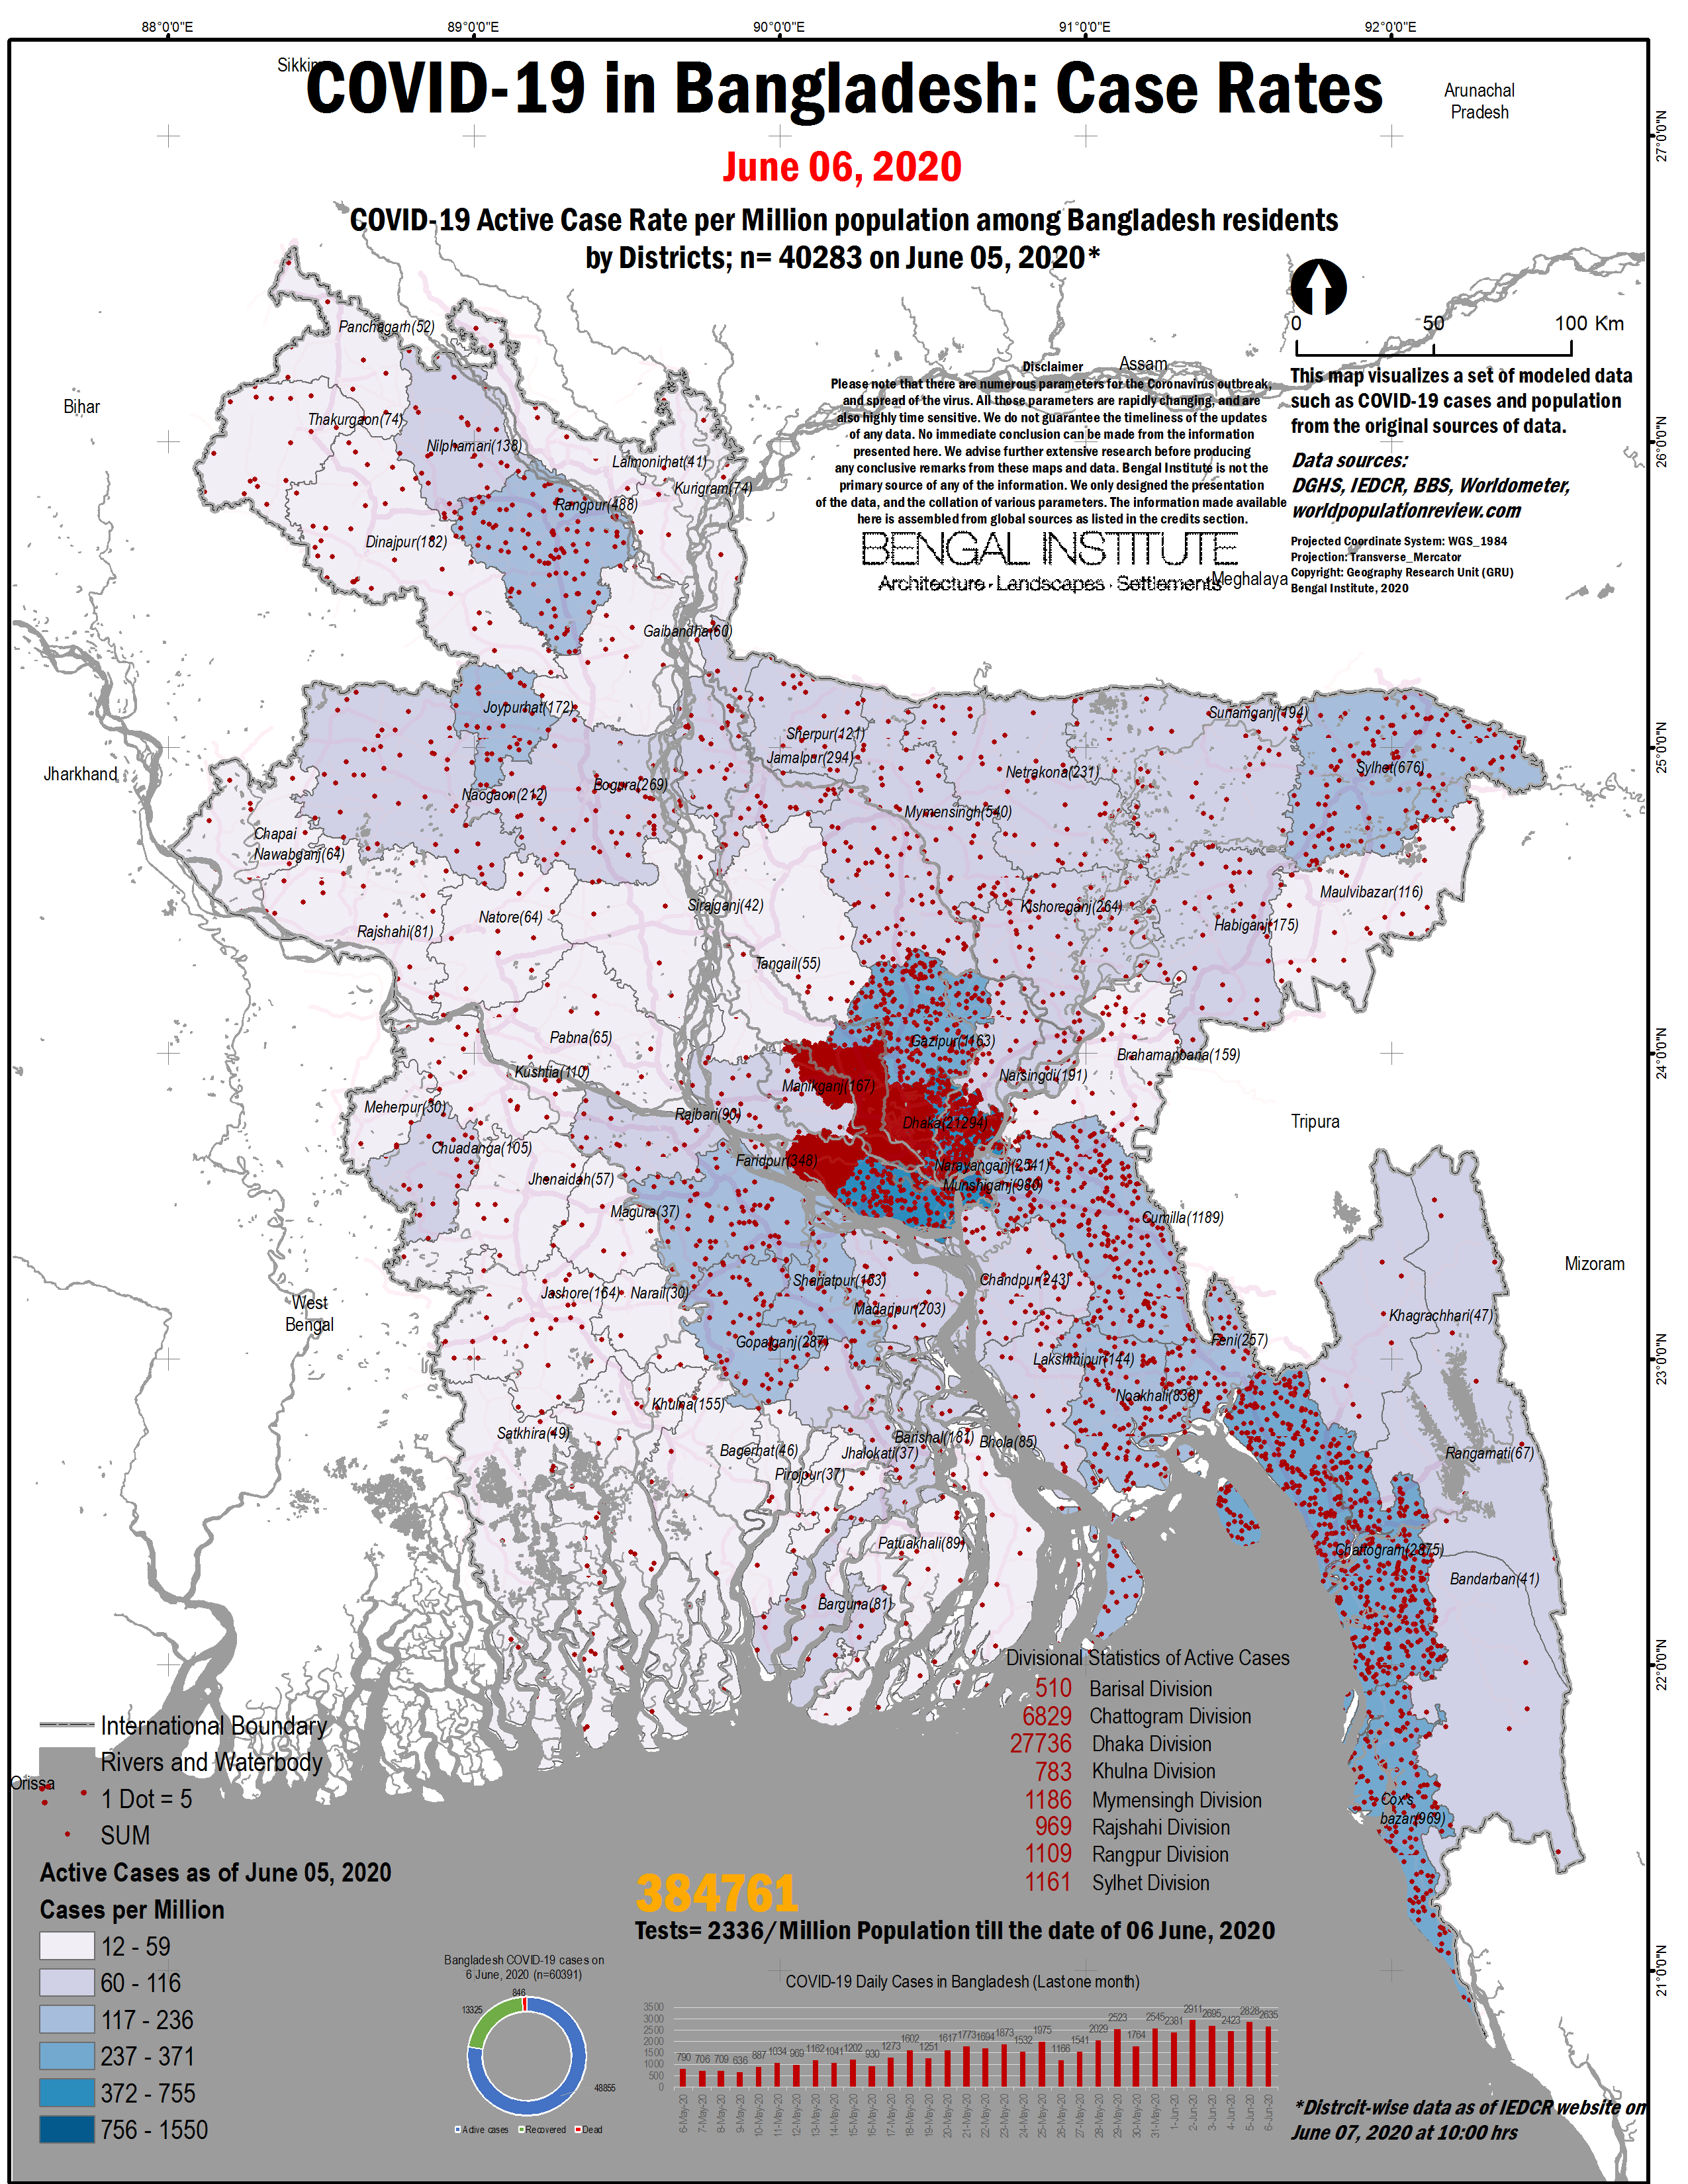
Figure 5: Covid-19 Case Rate Map showing number of cases in Bangladesh on 6th June, 2020
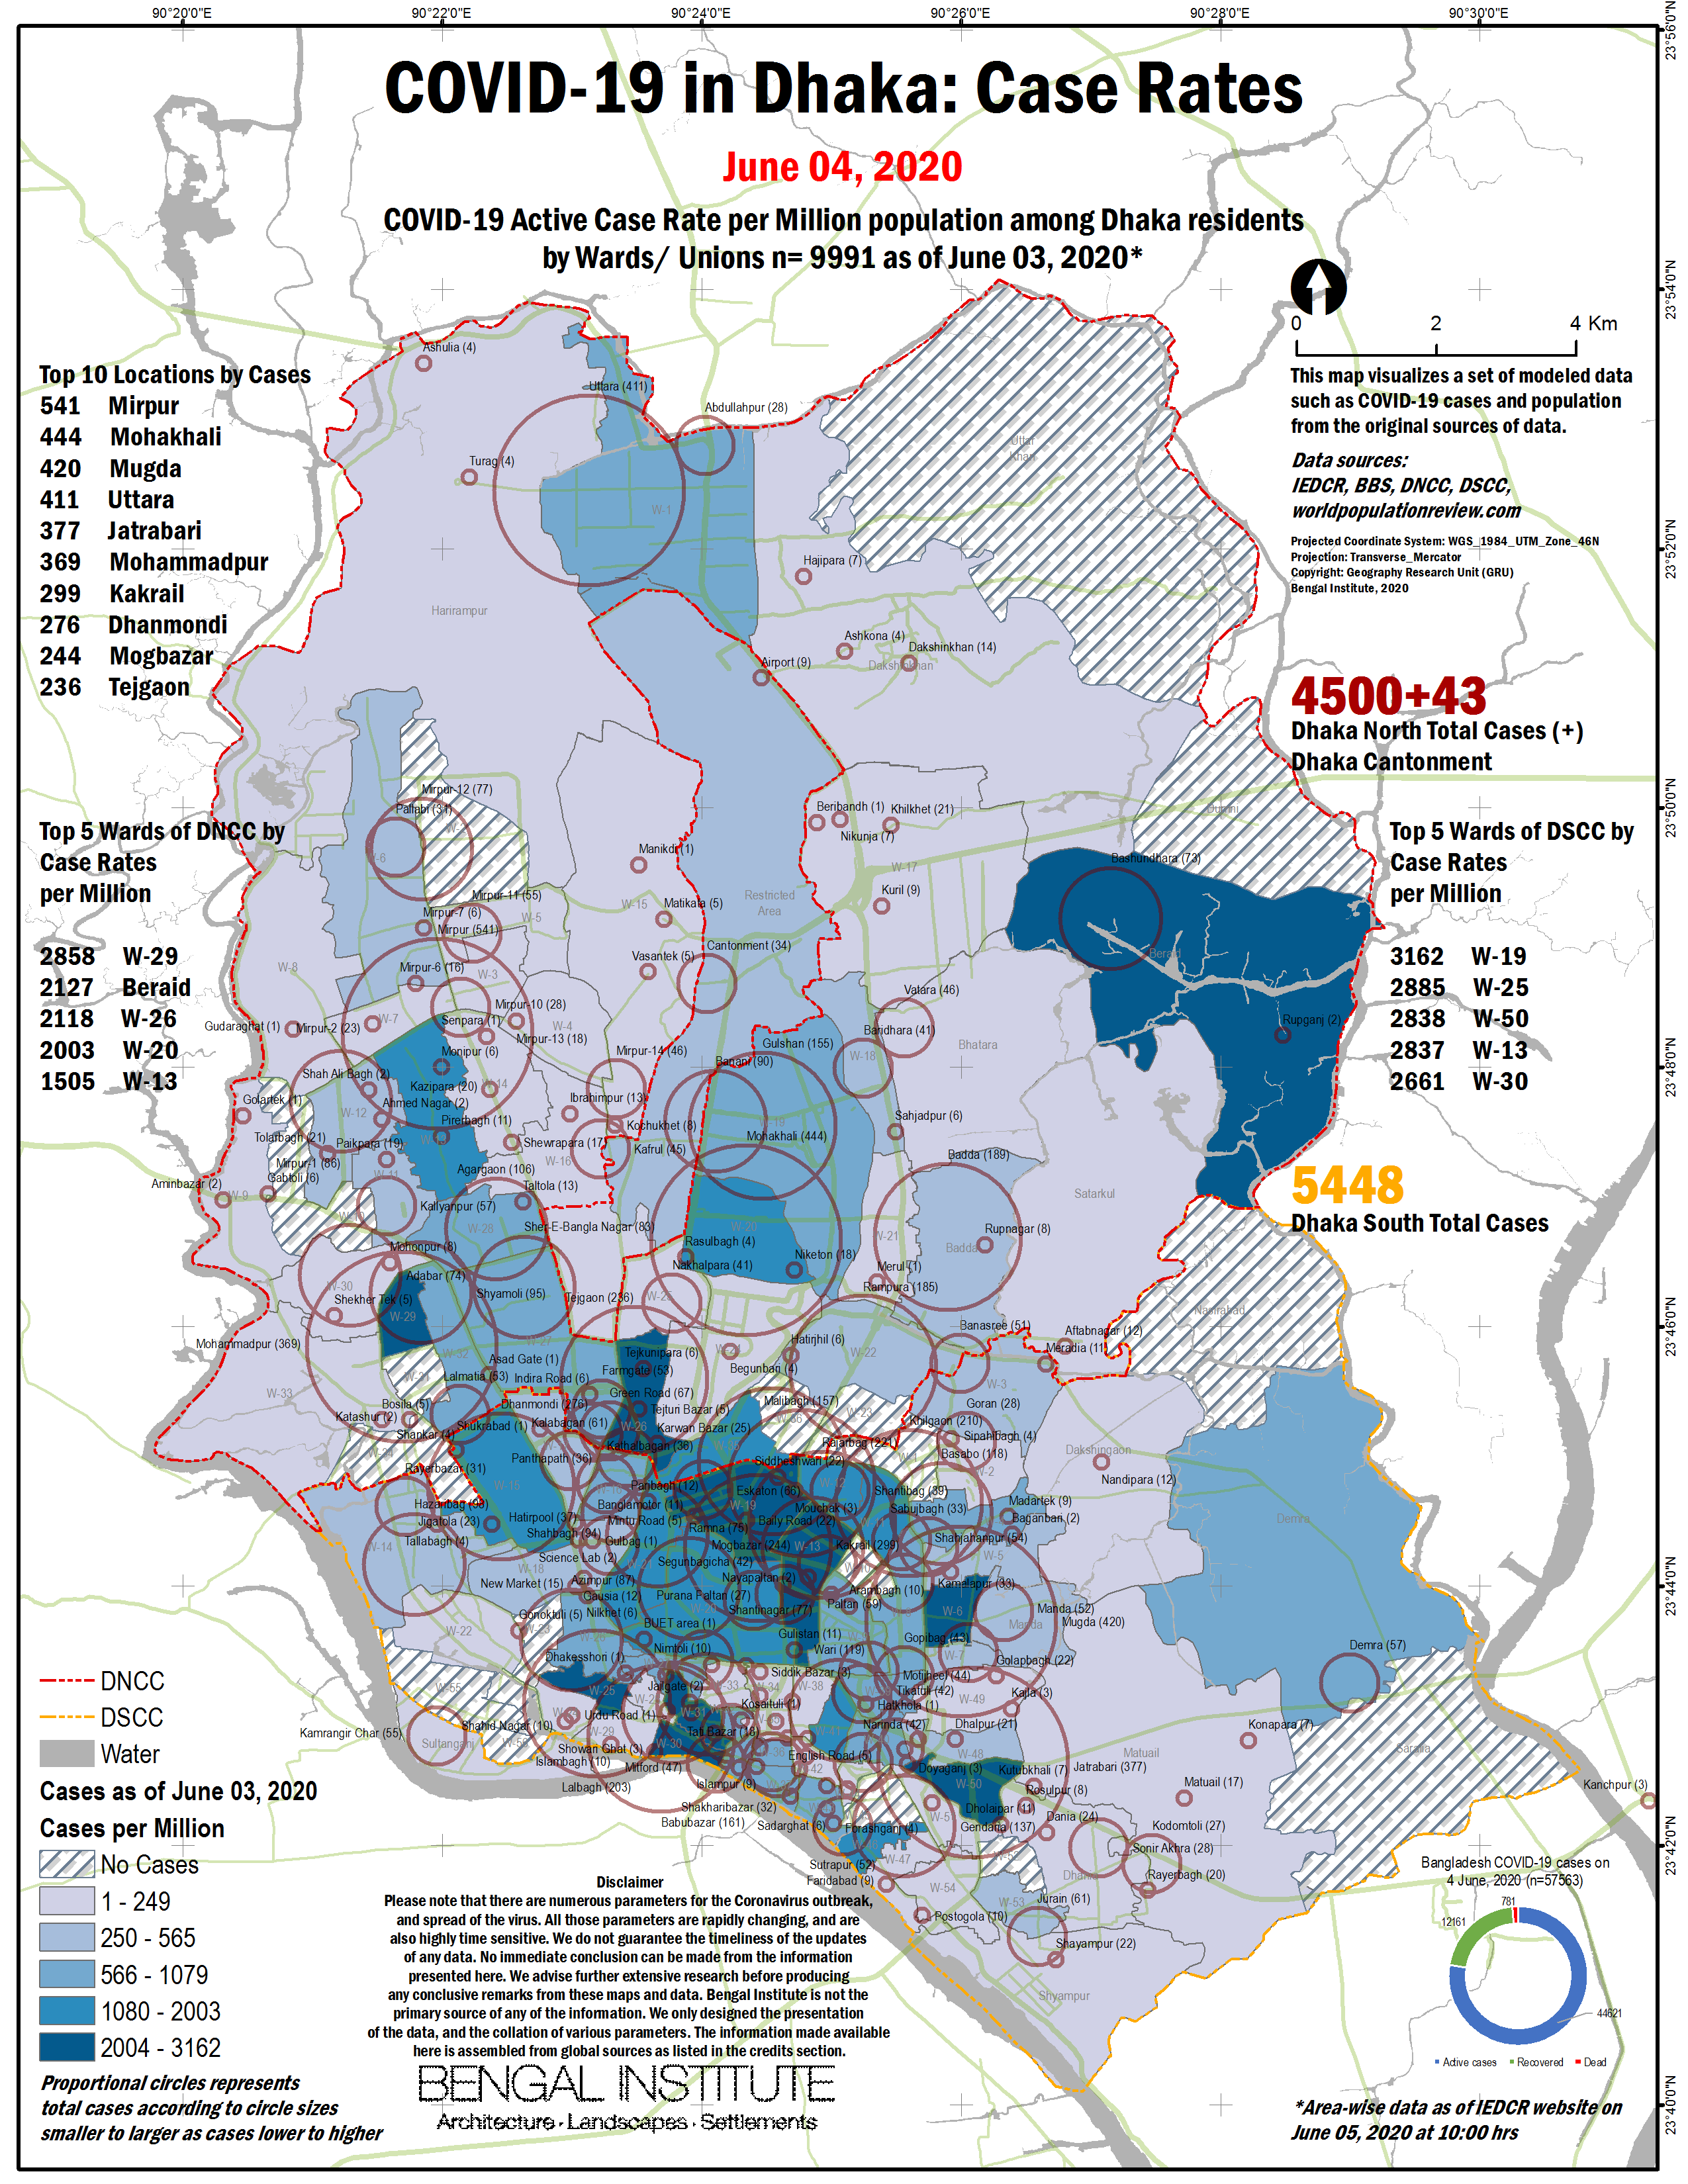
Figure 6: Covid-19 Case Rate Map showing number of cases in Dhaka on 4th June, 2020
“Getting data at real time was another great challenge,” says Razi. He adds that “IECR takes one full day to publish data, and that delay makes a difference in case numbers. So proper analysis becomes challenging when real time data is not available.”
The case rate maps can help anyone with internet access, especially local government authorities such as city mayors and councilors, to operate the interactive maps of Dhaka and Bangladesh, identify which communities are at higher risk of adverse impacts from the outbreak, and take prompt actions accordingly.
“Over six months have passed since the first cases of Covid-19 were detected in China; we now have opportunities for more research with the data collected during that time. So from here, we can come up with new ideas on how to strategically deal with it,” says Razi.
Making a Preparedness Plan
When the team brainstormed ideas for comprehensive plans for Covid-19 responses, team members Sabiha Haque and Samira Marzia began looking into the strategic actions taken by other Asian countries which have effectively dealt with the Covid-19 crises, and put together a report based on the findings which was published in the Dhaka daily The Daily Star on 23rd April, 2020. The article also included the kind of actions that could be suitable for Bangladesh in limiting the spread of the coronavirus.
“I have a few family members working in the frontline for the New York State Department of Health and they told me about the severity of it,” says Sabiha Haque, who was personally motivated to start research on this topic. Research was primarily conducted using authentic documents from host countries’ Centres for Disease Control and Prevention. A relationship between public health and urban planning was established by the team members Haque and Samira Marzia, and the learnings from the host countries were connected to that.
“The biggest challenge was sourcing data and information. Covid-19 is an inconsistent issue, where information and findings are changing everyday. So the primary concern was to find out the authenticity of information,” says Haque. The geographers at Bengal Institute provided the thana boundary maps while the relevant ward boundary maps were made from scratch by Haque, using updated population data sets from 2016-17. This data set was also used to map high density settlement ward areas, which was then plotted in relevant thanas.
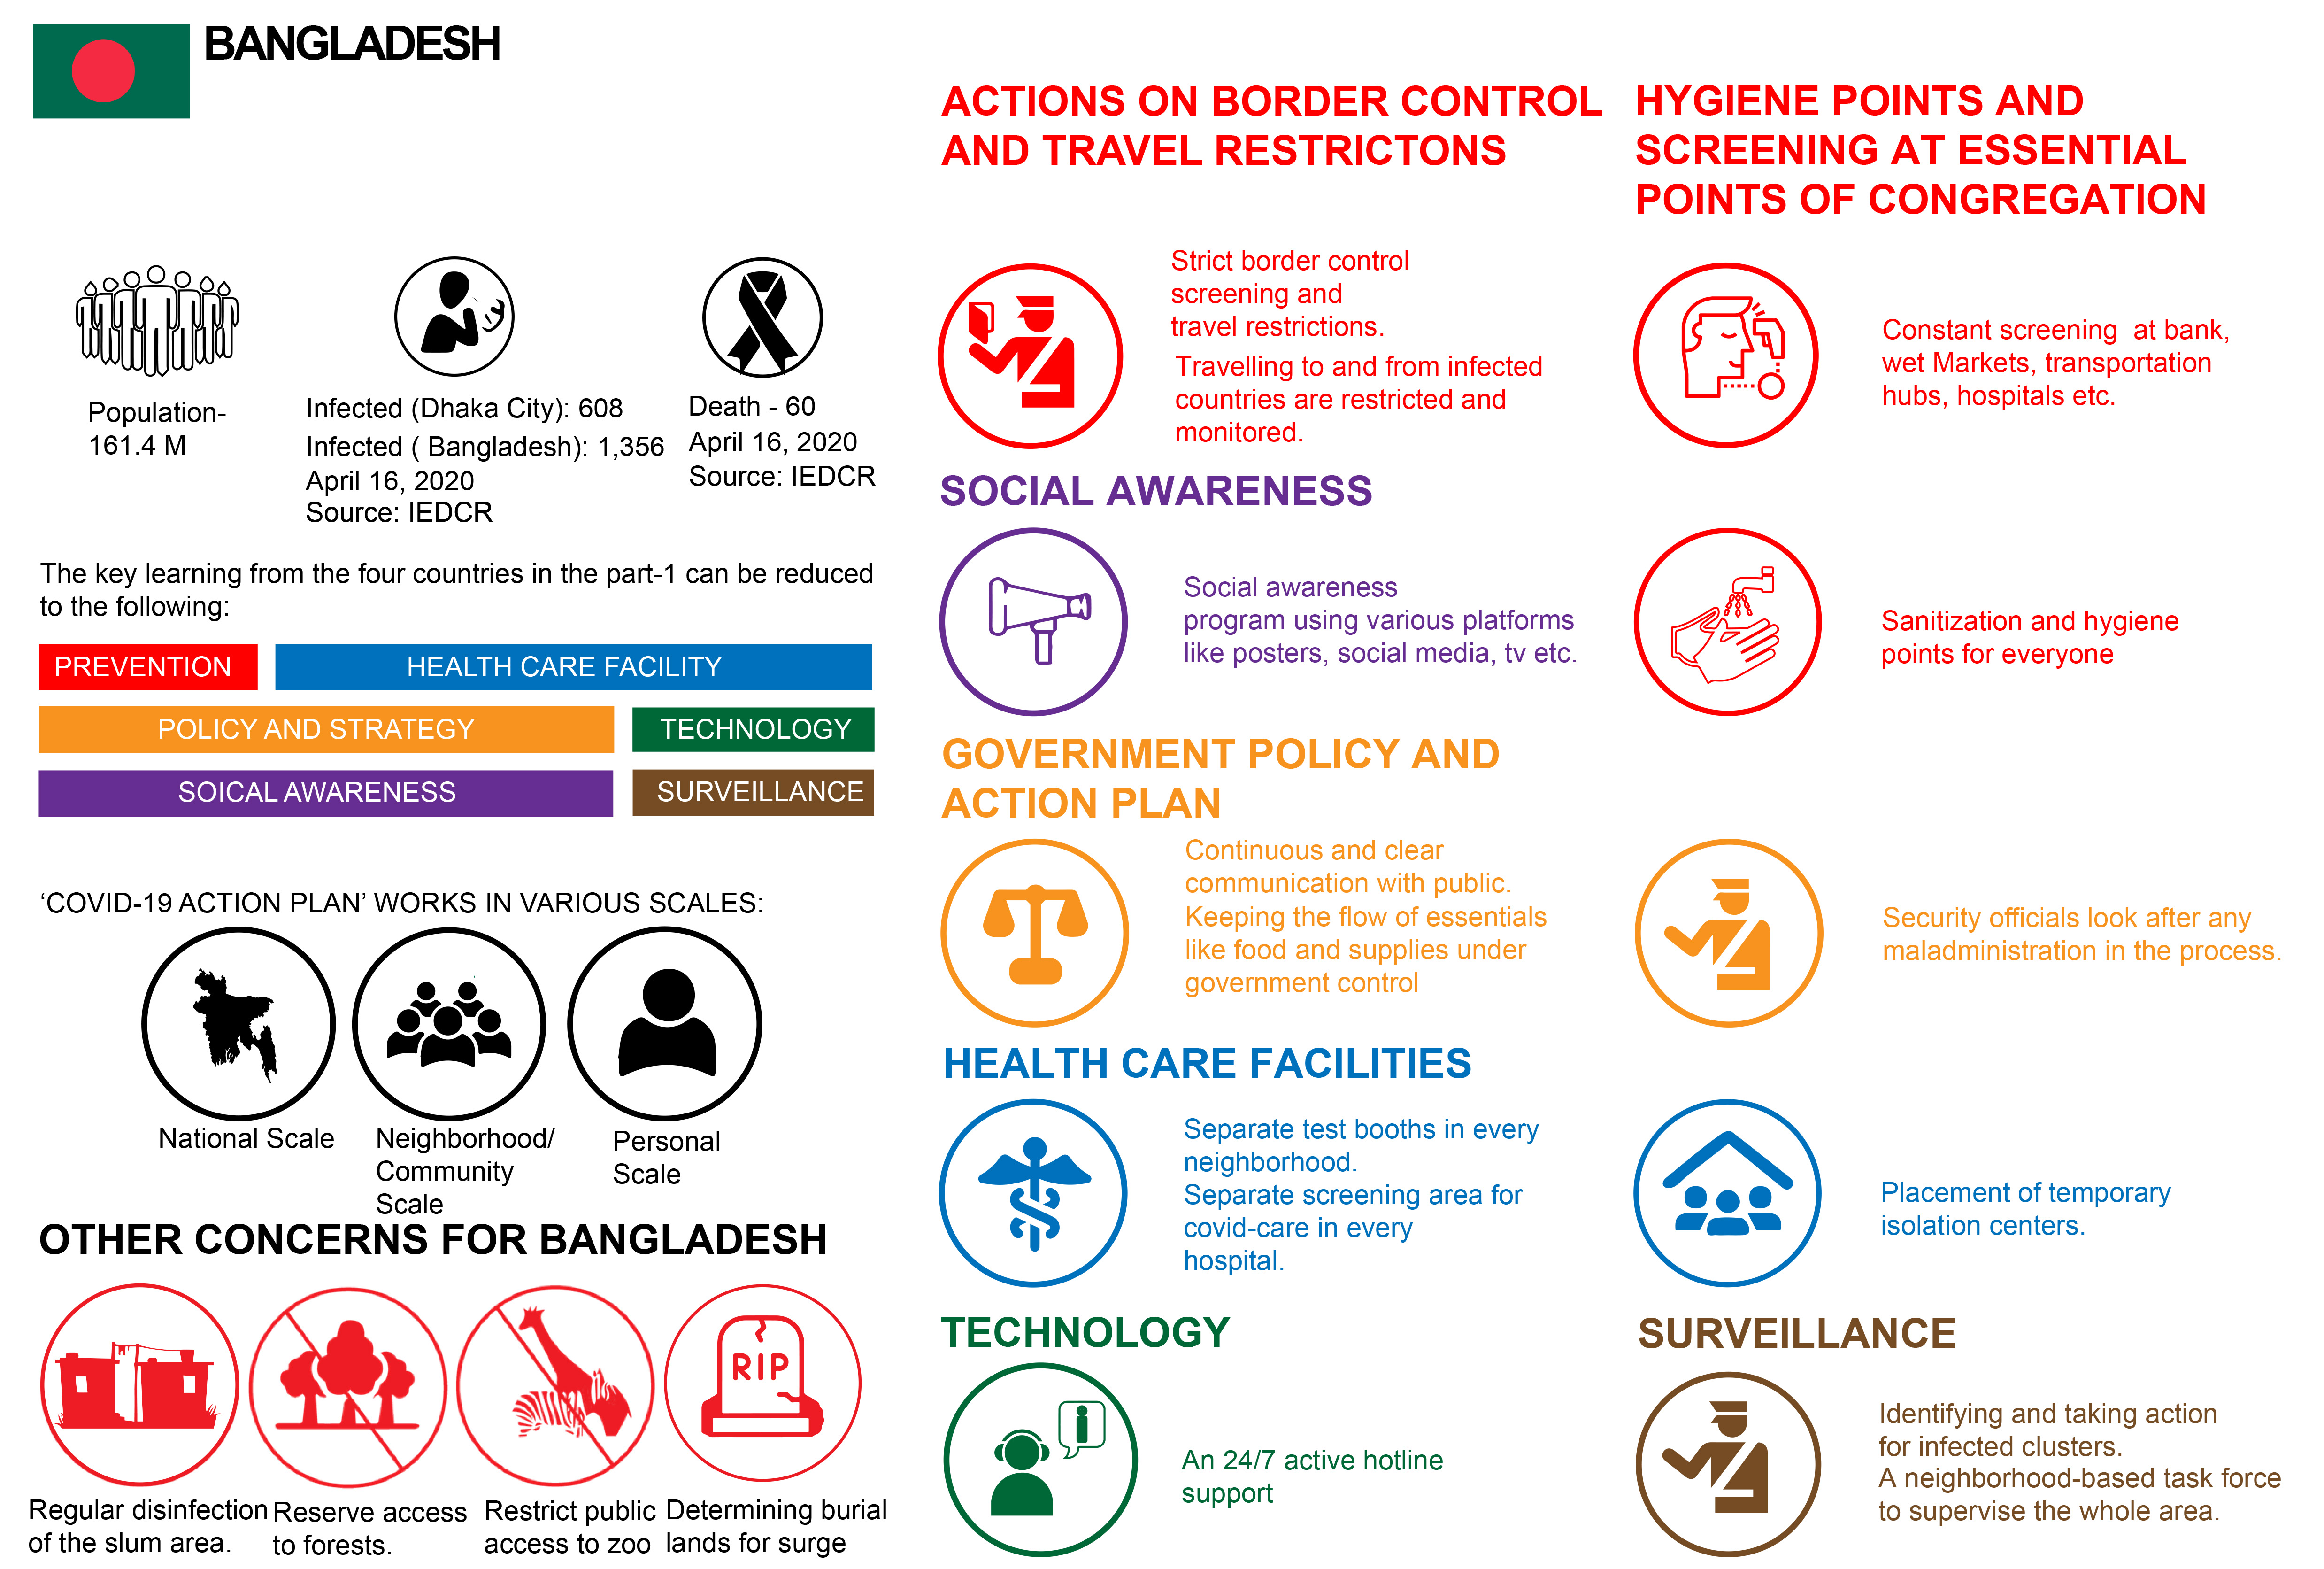
Figure 7: Strategic actions necessary to tackle COVID-19 in Dhaka
“The whole idea of the study required constant brainstorming among ourselves and being up-to-date about how affected countries are dealing with this pandemic,” says Samira Marzia. China, Singapore, South Korea and Singapore were considered as the primary study areas. Marzia further describes, “To relate our findings with Bangladeshi context by addressing our challenges caused a significant outcome of our research. For me, that’s an interesting reflection of the research process.”
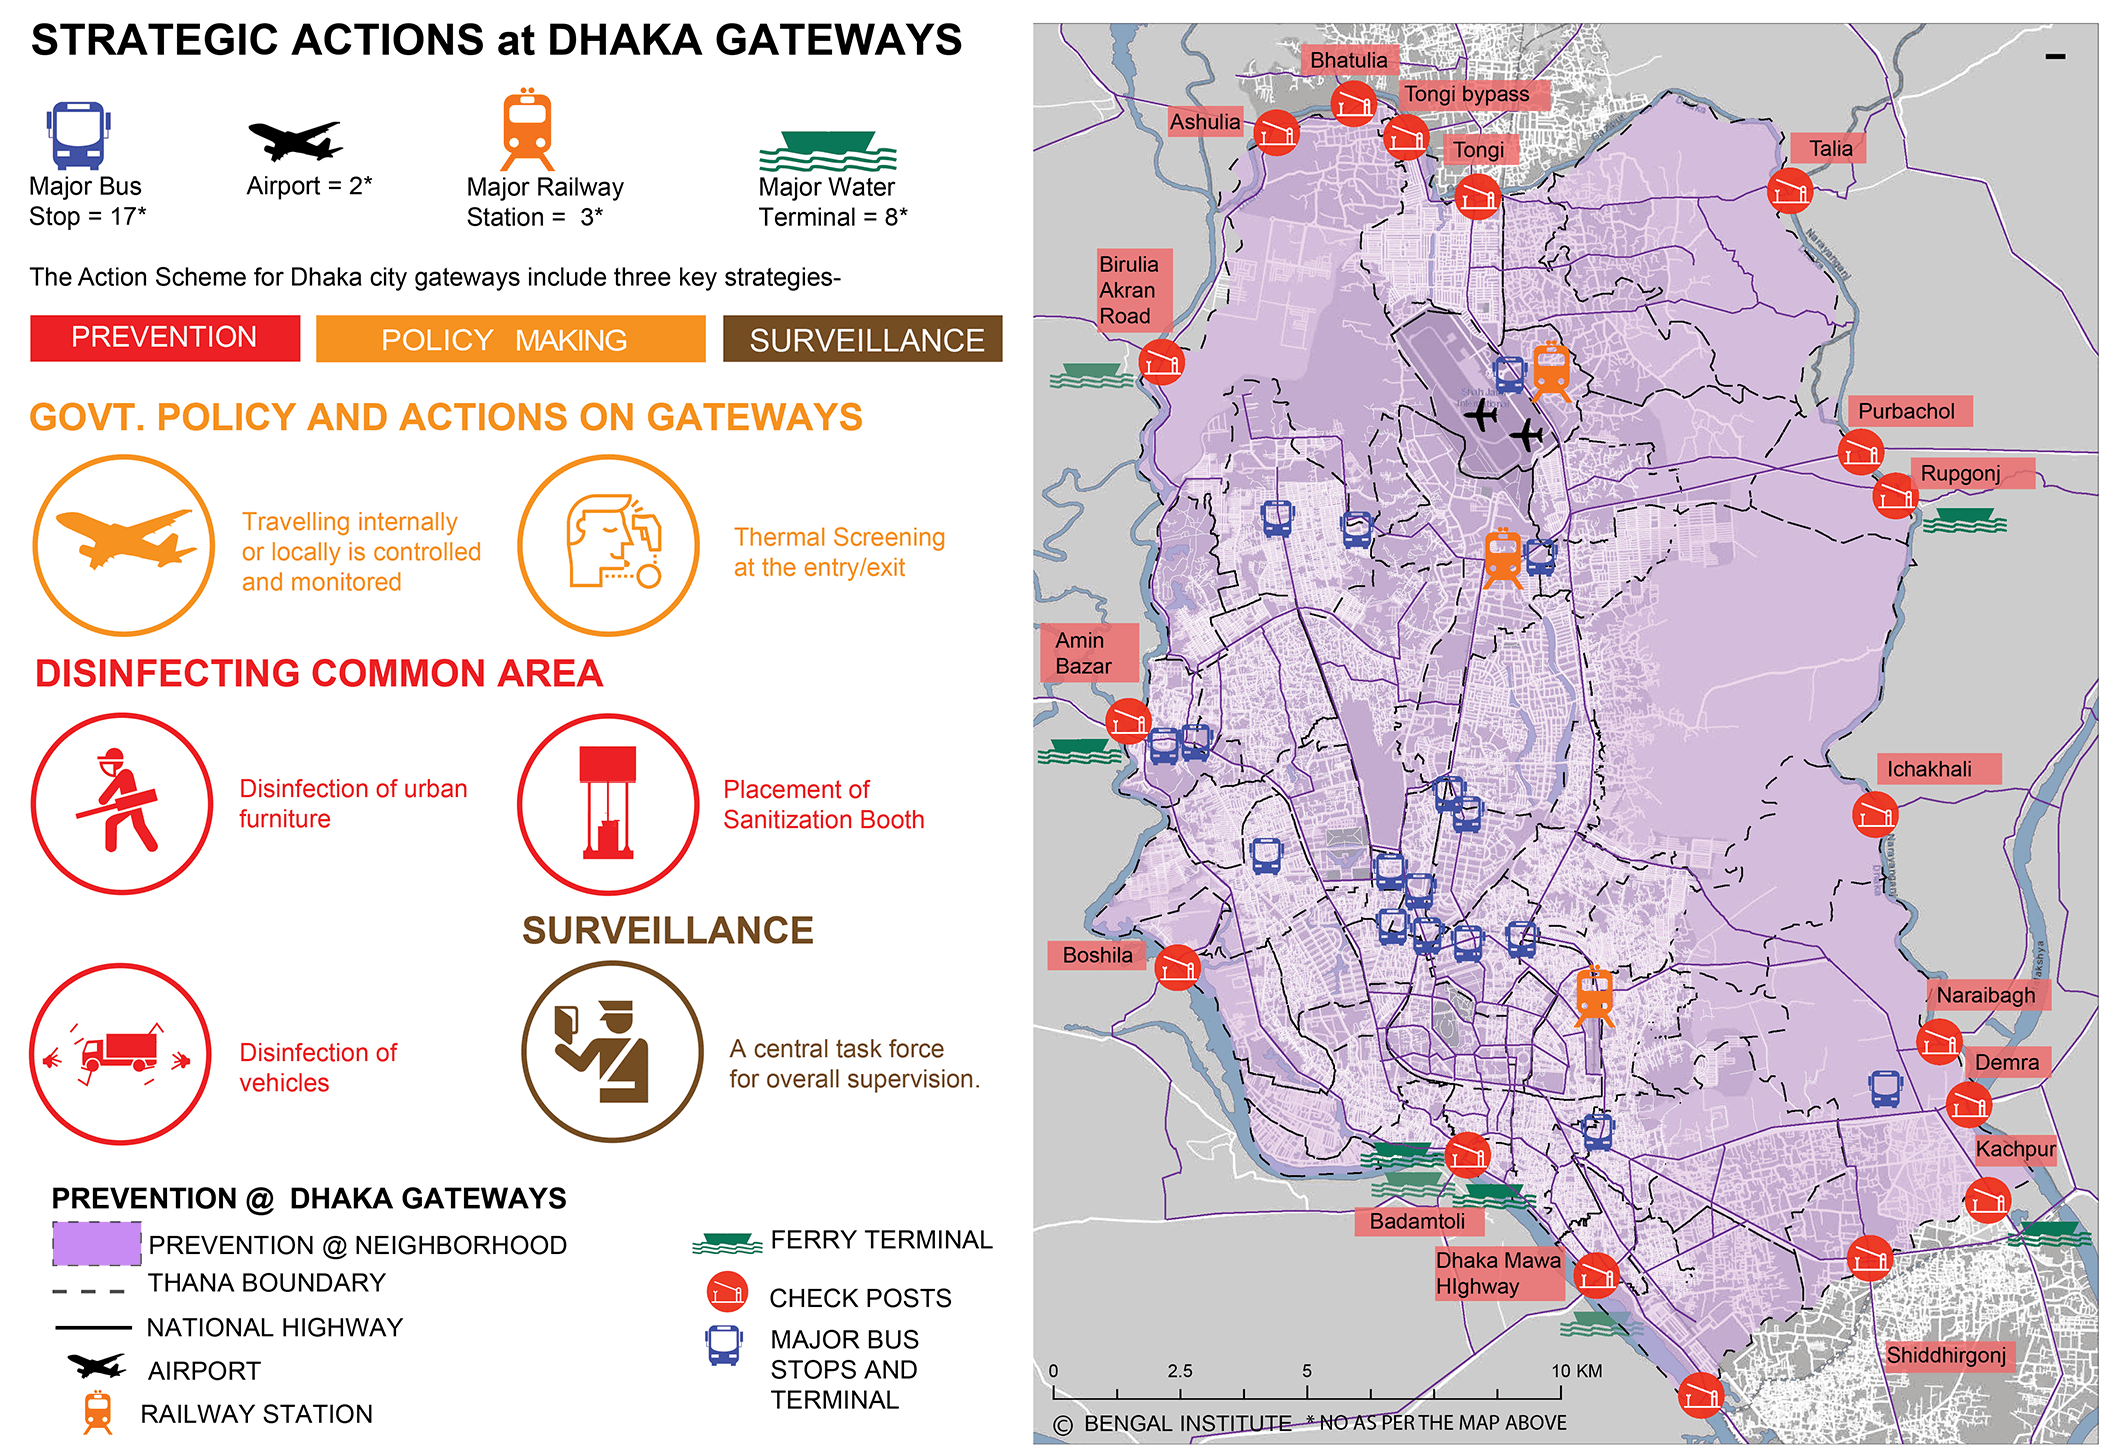
Figure 8: Strategic actions necessary at Dhaka gateways to tackle Covid-19
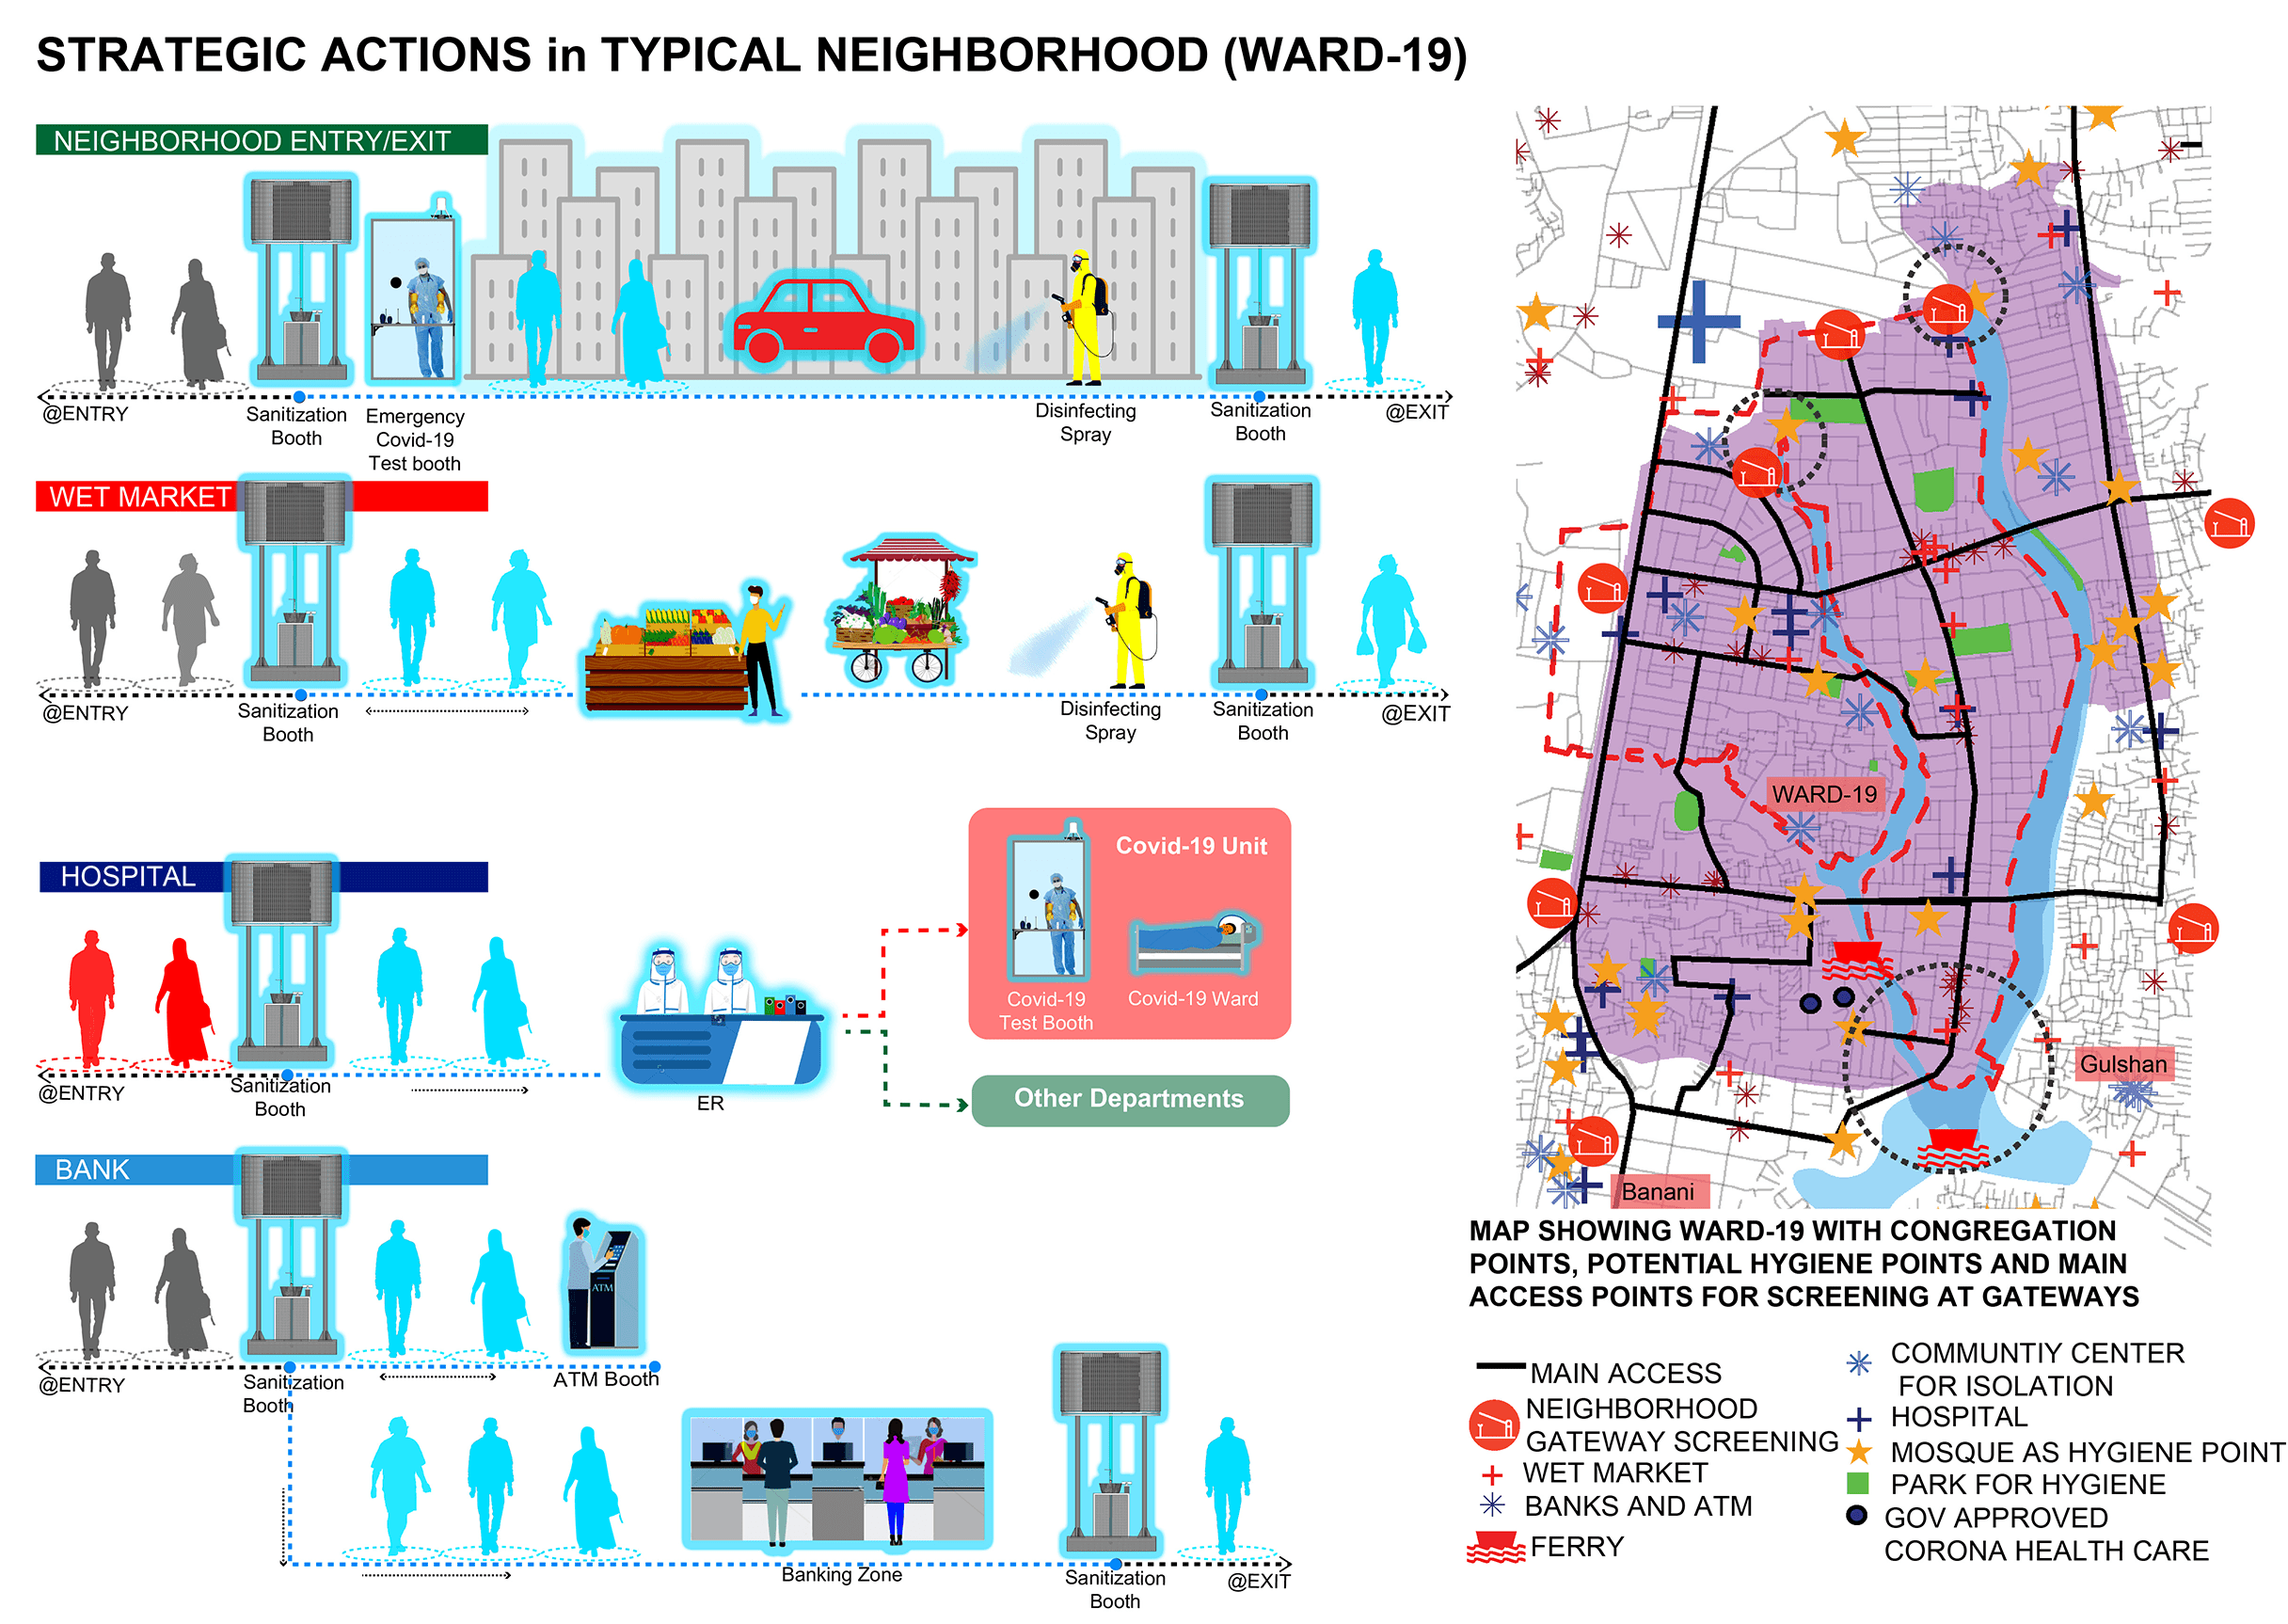
Figure 9: Strategic actions necessary in a typical neighbourhood to tackle Covid-19 in Dhaka
The published writeup was essentially a sum of the research works the team had been involved in. Sabiha Haque said, “Since the article came out, we saw architects writing about relevant Covid-19 related topics for Bangladesh. And it is a great start to continue the dialogue on public health and life.”
Both the team members are keen on continuing research on this issue. Samira Marzia hopes to continue keeping track of the effects of the pandemic over time. Sabiha Haque aims to write on how the Covid-19 crisis will affect architecture, city planning and open spaces, product design and even the profession itself.
“It felt like I was destroying the virus while making the awareness campaign.”
Effective communication is essential for tackling health emergencies like the Covid-19 outbreak. Hence, Bengal Institute took the initiative to raise public awareness through posters, visualisations and animation videos which were circulated online in the first week of April, 2020.
For the awareness campaign, team member Nazmus Sakib, who is skilled in motion graphics and videography, created the storyboard with Nusrat Sumaiya and Kazi Khaleed Ashraf. Once the storyboard was finalised, the characters and other elements were animated. Drawings for the animation and poster were made by Oona Ashraf, an architecture freshman at Pratt Institute, who contributed all the way from Philadelphia, United States. Individual animated clips were created by Zarin Tasnim and Nazmus Sakib.

Figure 10: Awareness campaign by Bengal Institute in response to Covid-19
“I have always been enthusiastic about animation and films. I think it is a convenient way to pass on information to the mass people by this medium,” says Nazmus Sakib. He believes visuals are also very impactful in spreading awareness in a much faster way and to a wider audience. For Zarin Tasnim, having prior experience in the visual medium made things easier for her. “I have expertise in animation and videography through my past job experience. That’s why I felt skilled and confident enough to make an animation regarding Covid-19,” she says.
However, it was challenging to put the campaign together while the team was social distancing. “The process was a bit difficult. Since we were working from home, it was tough to discuss ideas with everyone,” says Sakib. For Tasnim, it was a rewarding experience as it made her feel like she was actively participating in fighting the pandemic. “The whole process was fulfilling as it reduced my stress during this pandemic. It felt like I was destroying the virus while making the awareness campaign,” she says.
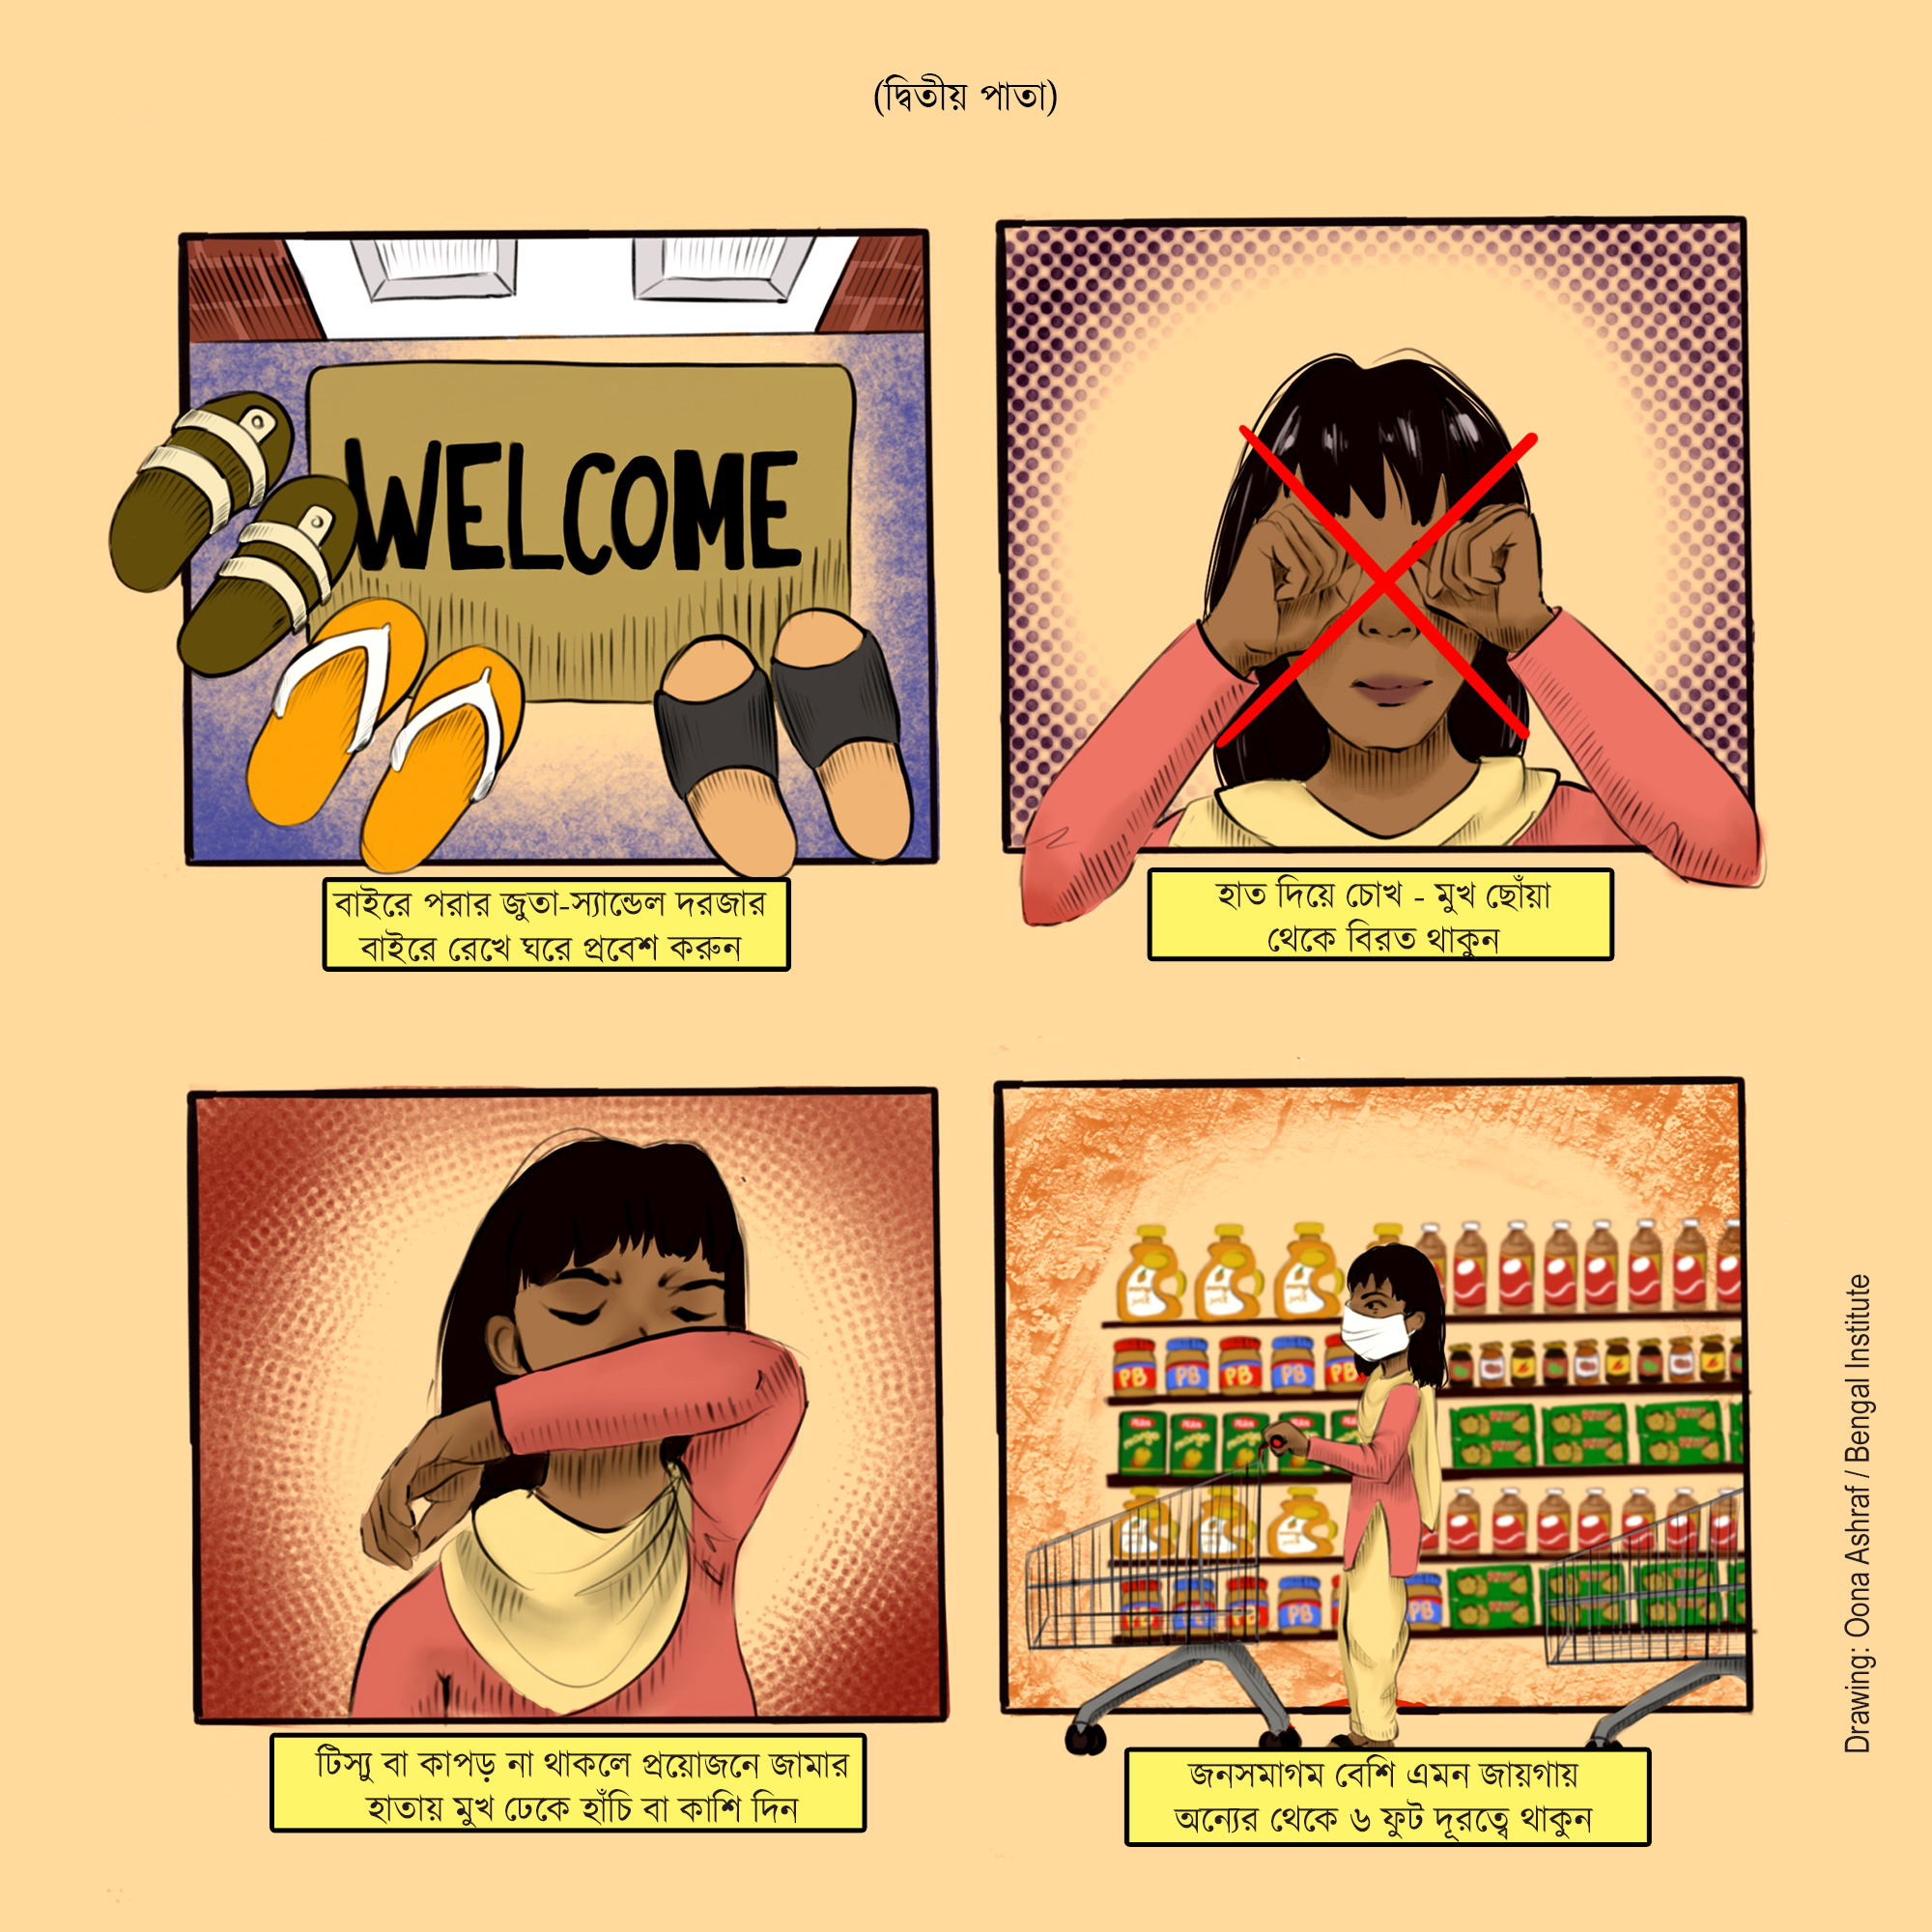
Figure 11: Awareness campaign by Bengal Institute in response to Covid-19
As part of the awareness campaign, Bengal Institute has produced posters which are available for download, and an instructional animation video to fight the pandemic. An effective awareness campaign can help to manage people’s fears and expectations, and provide guidelines on how to respond to the situation. This is what this campaign hopes to achieve.
Tasnim added that, “The whole team had taken this matter sensitively, and worked in a serious manner because our idea was to reach out to people in the most effective way. Language and the timing were choreographed in such a way that people can understand and grasp it easily.”
Bengal Shurokkha Station
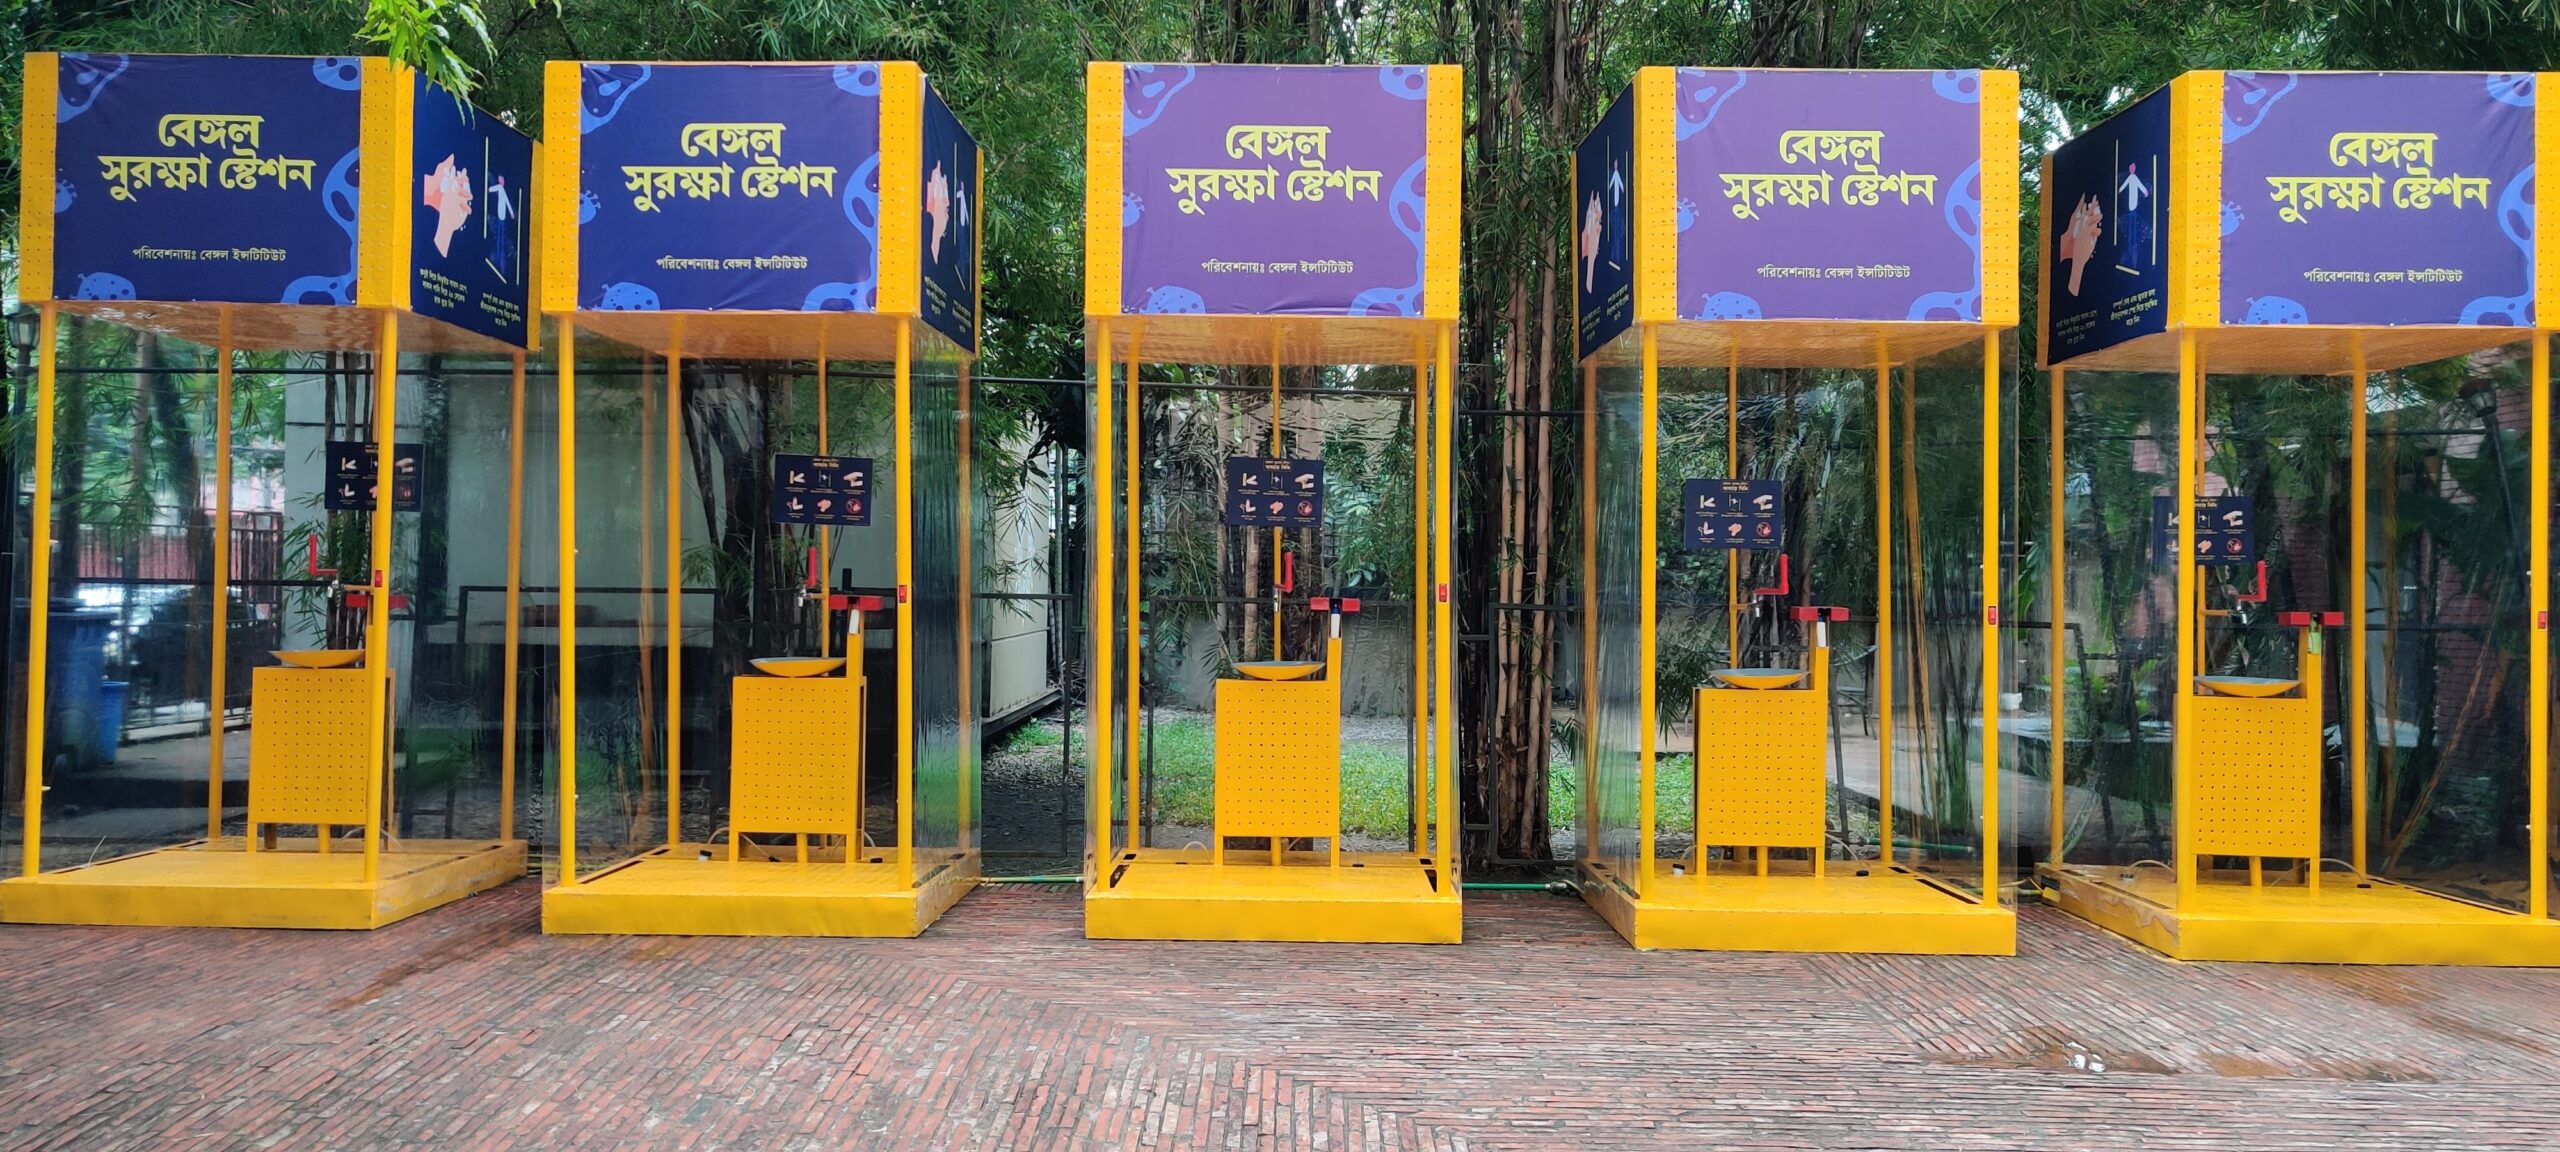 Figure 12: Bengal Shurokkha Stations at Bengal Gallery of Fine Arts, Dhaka
As a part of the collective effort to keep our environment virus-free in the midst of the pandemic, a sanitisation device was designed by the design and research team of Bengal Institute. The device called the Bengal Shurokkha Station was designed as a low cost unit with three kinds of antibacterial and liquid soap, and can be easily assembled using the guidelines provided by the Institute.
According to the WHO, the protein layer of the coronavirus dissolves in contact with soap molecules. Hence, it is evident that it is essential to wash one’s hands with soap water to fight the spread of the virus. With that consideration in mind, Bengal Institute has devised the Shurokkha Station, which can be used for washing hands and also spraying disinfectants on clothes and surfaces.
One of the team members, Hassan Mohammad Rakib initially thought of a rudimentary sanitisation technique, using an umbrella. “When the virus started spreading at first, I watched a video about a disinfecting tunnel built in Iran. That’s how I got the idea of making a device that would sanitise those on duty in public like police officers, doctors, bankers, and pedestrians who had to step out for work purposes,” he says. Often a simple and effective action as handwashing is not available for many on the streets of Dhaka. Using a DC powered pump, spraying nozzles and an umbrella, the disinfecting device was built, and some initial testing was done to check its functionality.
“We understood from the beginning that safety and sanitisation were the primary considerations,” says Nusrat Sumaiya, who orchestrated the whole project. Based on that understanding, the initial idea was to make a hand washing device, but later on Rakib’s idea of disinfectant system was incorporated into it to make it more effective. Finally, based on the design direction by Ashraf, the combination of the two became the sanitisation device.
The team took great risks to go out during the lockdown in search of materials and craftsmen when all stores were closed. Limited amounts of materials were collected with great difficulty from Nawabpur and Bongshal areas in Old Dhaka, but there were still no craftsmen available as most of them had left Dhaka when the lockdown was imposed. Nusrat Sumaiya located one of them in Uttara and upon requesting him, he agreed to work. A workshop was located in the same area, and after seeking permission from Uttara Police Station, the sanitisation device was assembled there. 20 devices were made in total at first, with the help of team member Syed Abdullah Al Rifat and the craftsmen. Work on the units began at the end of March and by 1st week of May, 25 sanitisation units were set up.
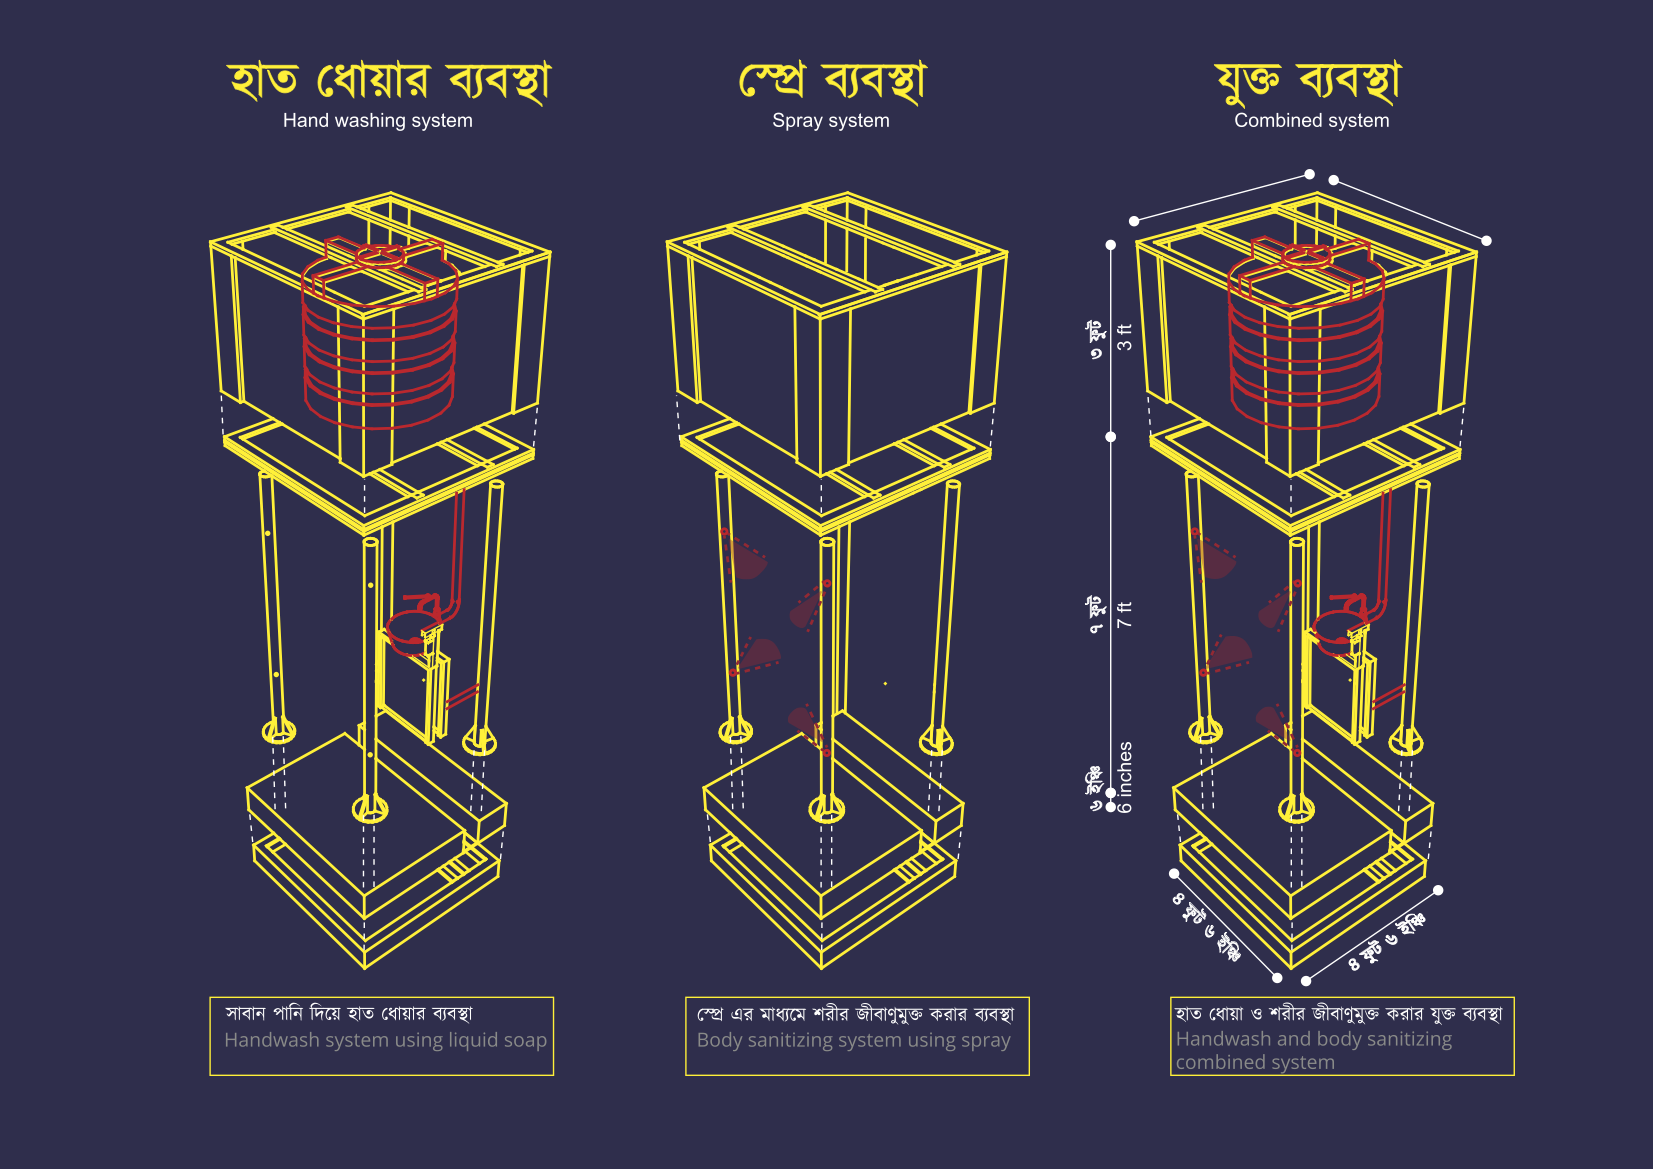 Figure 13: Functions of Bengal Shurokkha Station
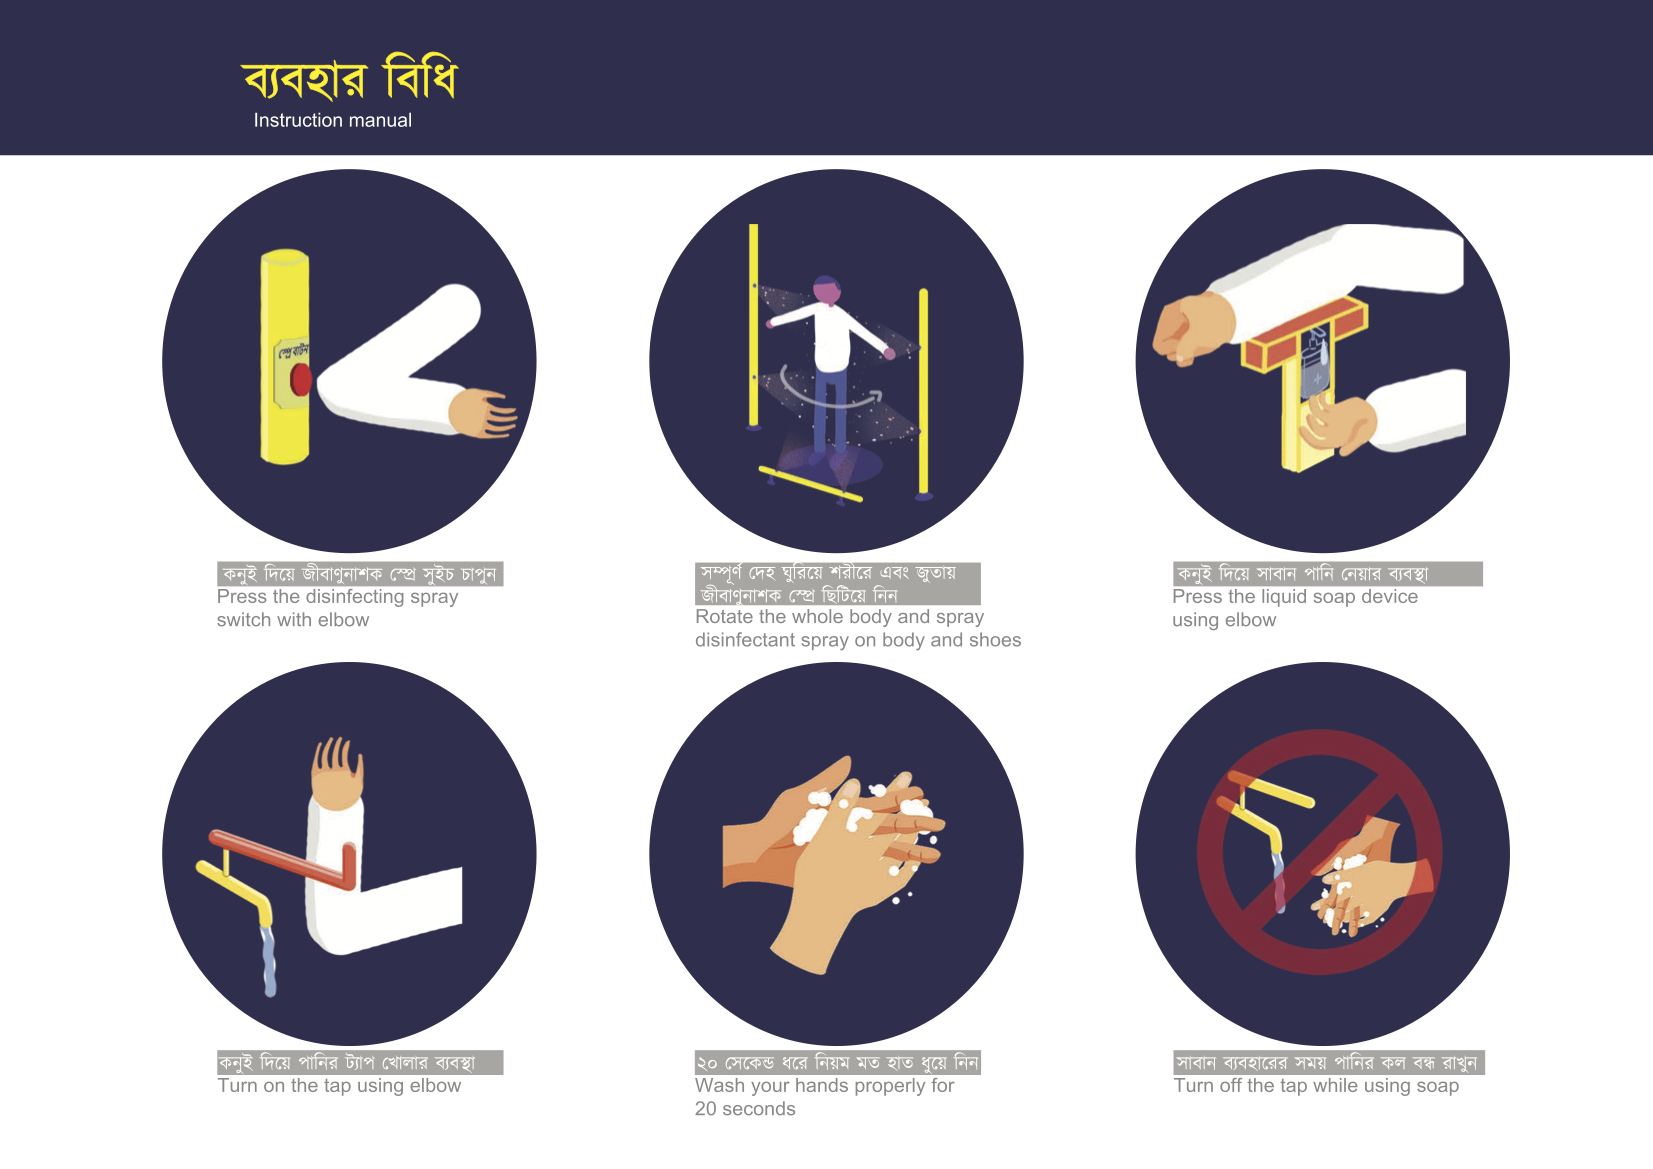 Figure 14: Instructions of using Bengal Shurokkha Station
However, finding the right disinfectant turned out to be a tricky part, because there was no research that could prove that disinfectants successfully eliminated risks of contamination. Additionally, for a middle-income country like Bangladesh, it was necessary that the sanitisation device is built with low overhead and maintenance costs.
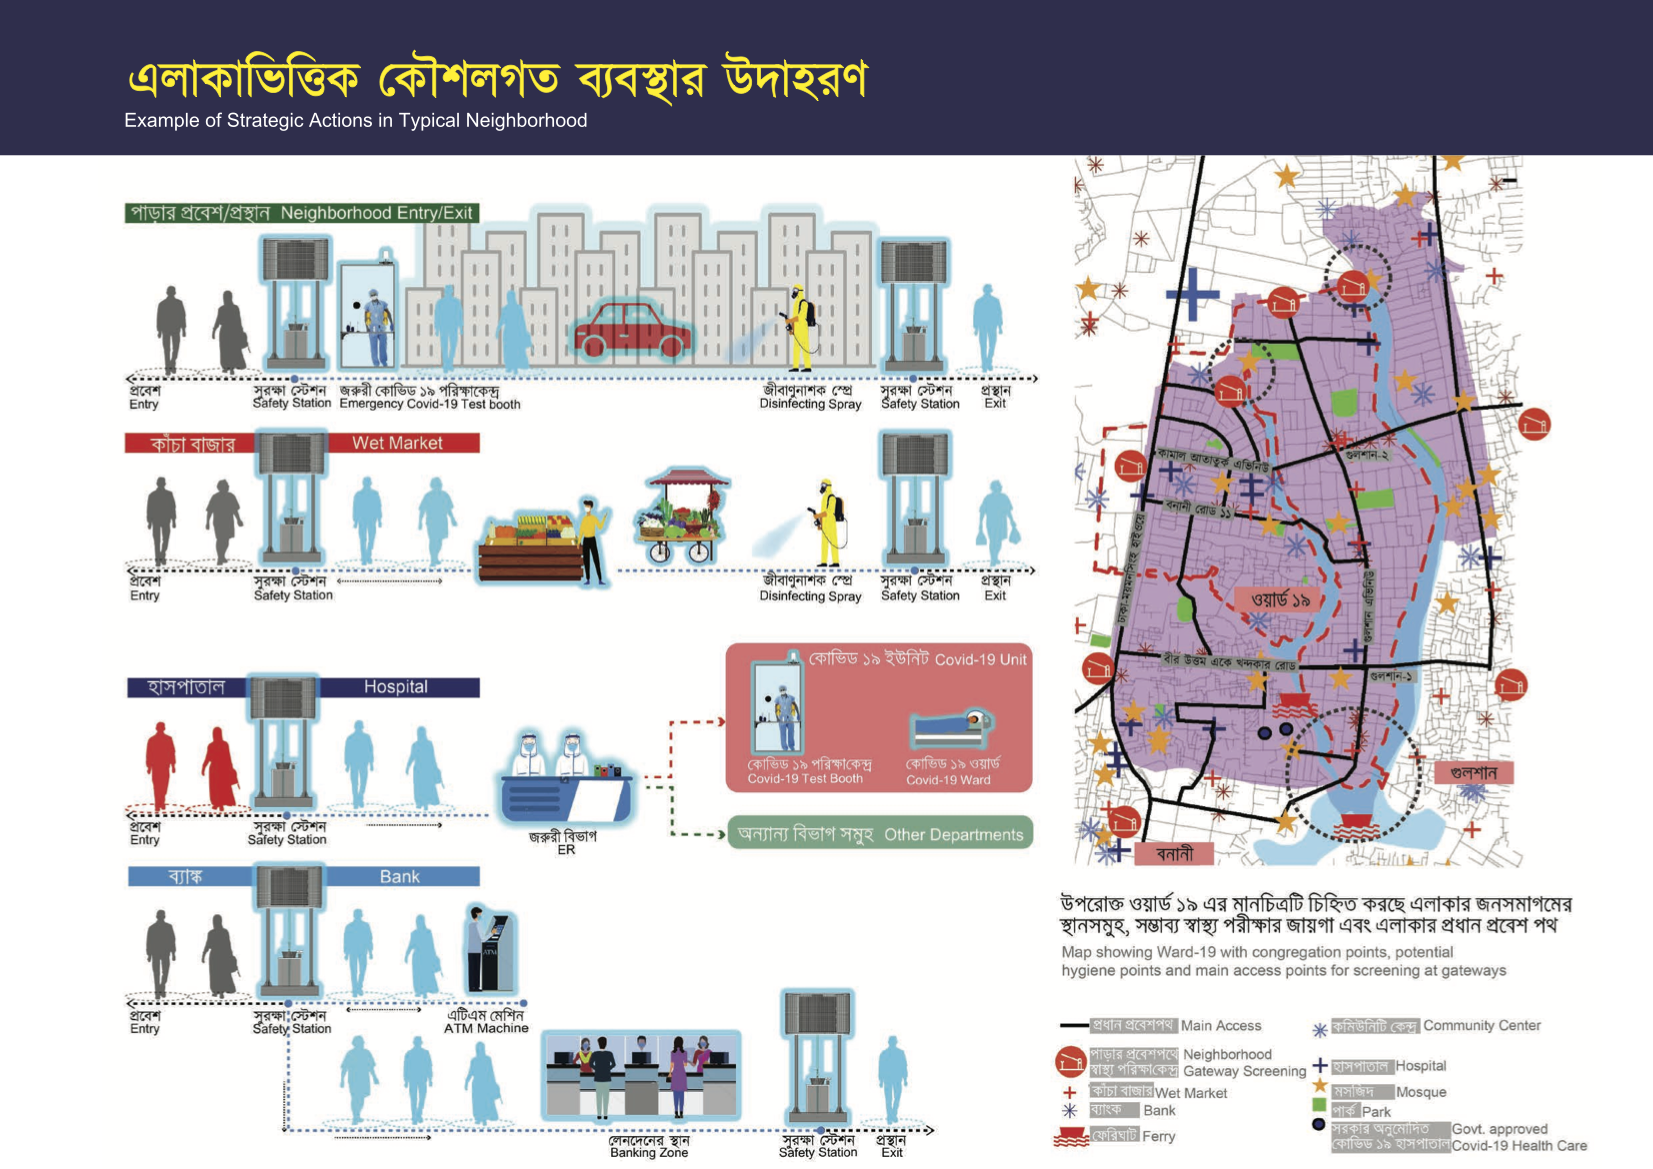 Figure 15: Examples of strategic actions in a typical neighbourhood
“Since we intended to make the sanitisation device operational for all, we produced an open source booklet that would provide guidelines on how to make it,” says another team member Rubaiya Nasrin. The booklet contains drawings and images of three-dimensional models with the materials used clearly labelled, so that anyone can follow the guidelines and build it. “We initiated this idea so that it can serve as many people as possible. So we tried to incorporate drawings in a way that it can be understood by the general public,” says Nasrin.
With the help of the police, RAB security force, armed force members, and volunteers, the device can be set up at critical public places of the city. This sanitisation device can be deployed especially for the safety of those who live in densely populated parts of the city, and have to be in public spaces for their daily earnings.
At present, sanitisation devices have been set up at RAB headquarters, Baridhara Society, Chayyanaut, Faculty of Fine Arts at University of Dhaka, Kushal Centre, Bengal Boi, Aranya, Bengal Gallery of Fine Arts, and will also be set up at campus of University of Liberal Arts (ULAB). Units of Bengal Shurokkha Station were also gifted to Selina Hayat Ivy, Mayor of Narayanganj City Corporation and Ariful Haque Chowdhury, Mayor of Sylhet City Corporation.
Safe Marketplaces
Initially, it was speculated that the virus first emerged from a wet market selling live animals in Wuhan, China. Although experts refuted that speculation later on, the WHO started working with the UN to develop guidelines to impose stricter hygiene practices and safety standards for wet markets. Since wet markets are an important source for affordable food items for people in different parts of the world, they remain as essential hubs for exchange and interaction. That is why, during the Covid-19 outbreak, it is necessary to ensure that these markets are functioning by maintaining all the necessary precautions. To address this, Bengal Institute proposed the idea for safe marketplaces and announced it publicly on 27th April, 2020.
“Wet markets are an important public space that connects people from various social classes,” says Nusrat Sumaiya who led this project. If safety in terms of interaction is not provided in these markets during the pandemic, it would lead to disastrous consequences. “Hence the main objective was to ensure hygiene and maintain public health during this crisis, and to provide economic opportunity for micro urbanist vendors and shopkeepers,” she says.
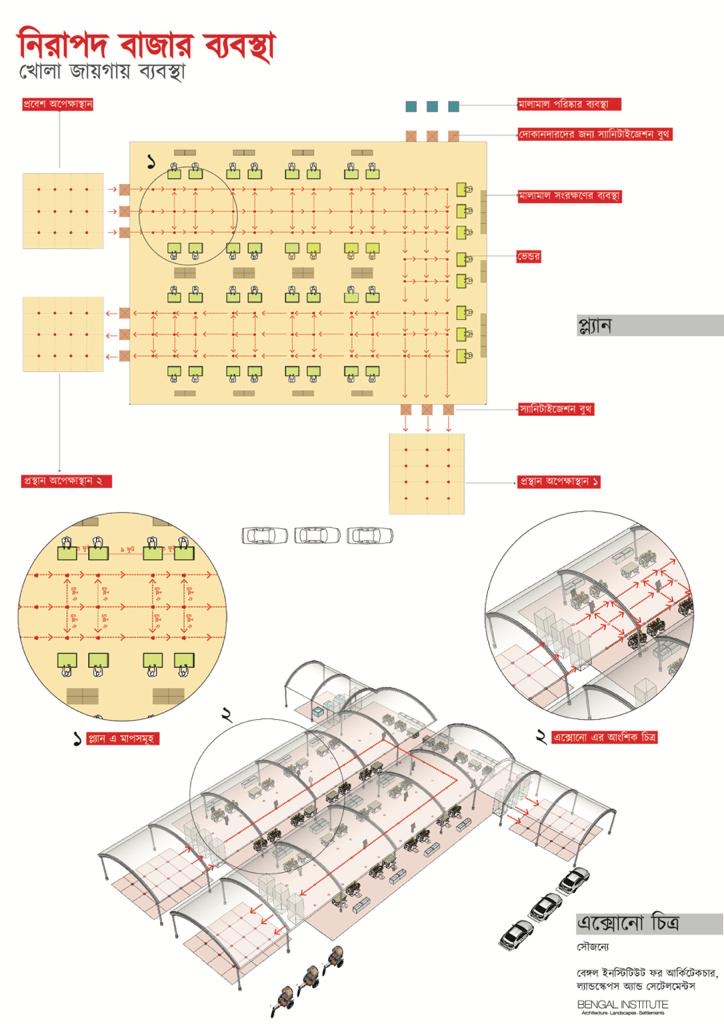
Figure 16: Axonometric view of the safe marketplace
The plan was to convert a street or open field into temporary marketplaces. “We ensured entry and exit points as well as separate pedestrian and vehicular access to those points. Based on the type and amount of fresh produce that would be brought in, we decided how the dry and wet zones will be demarcated,” says Nusrat Sumiaya.
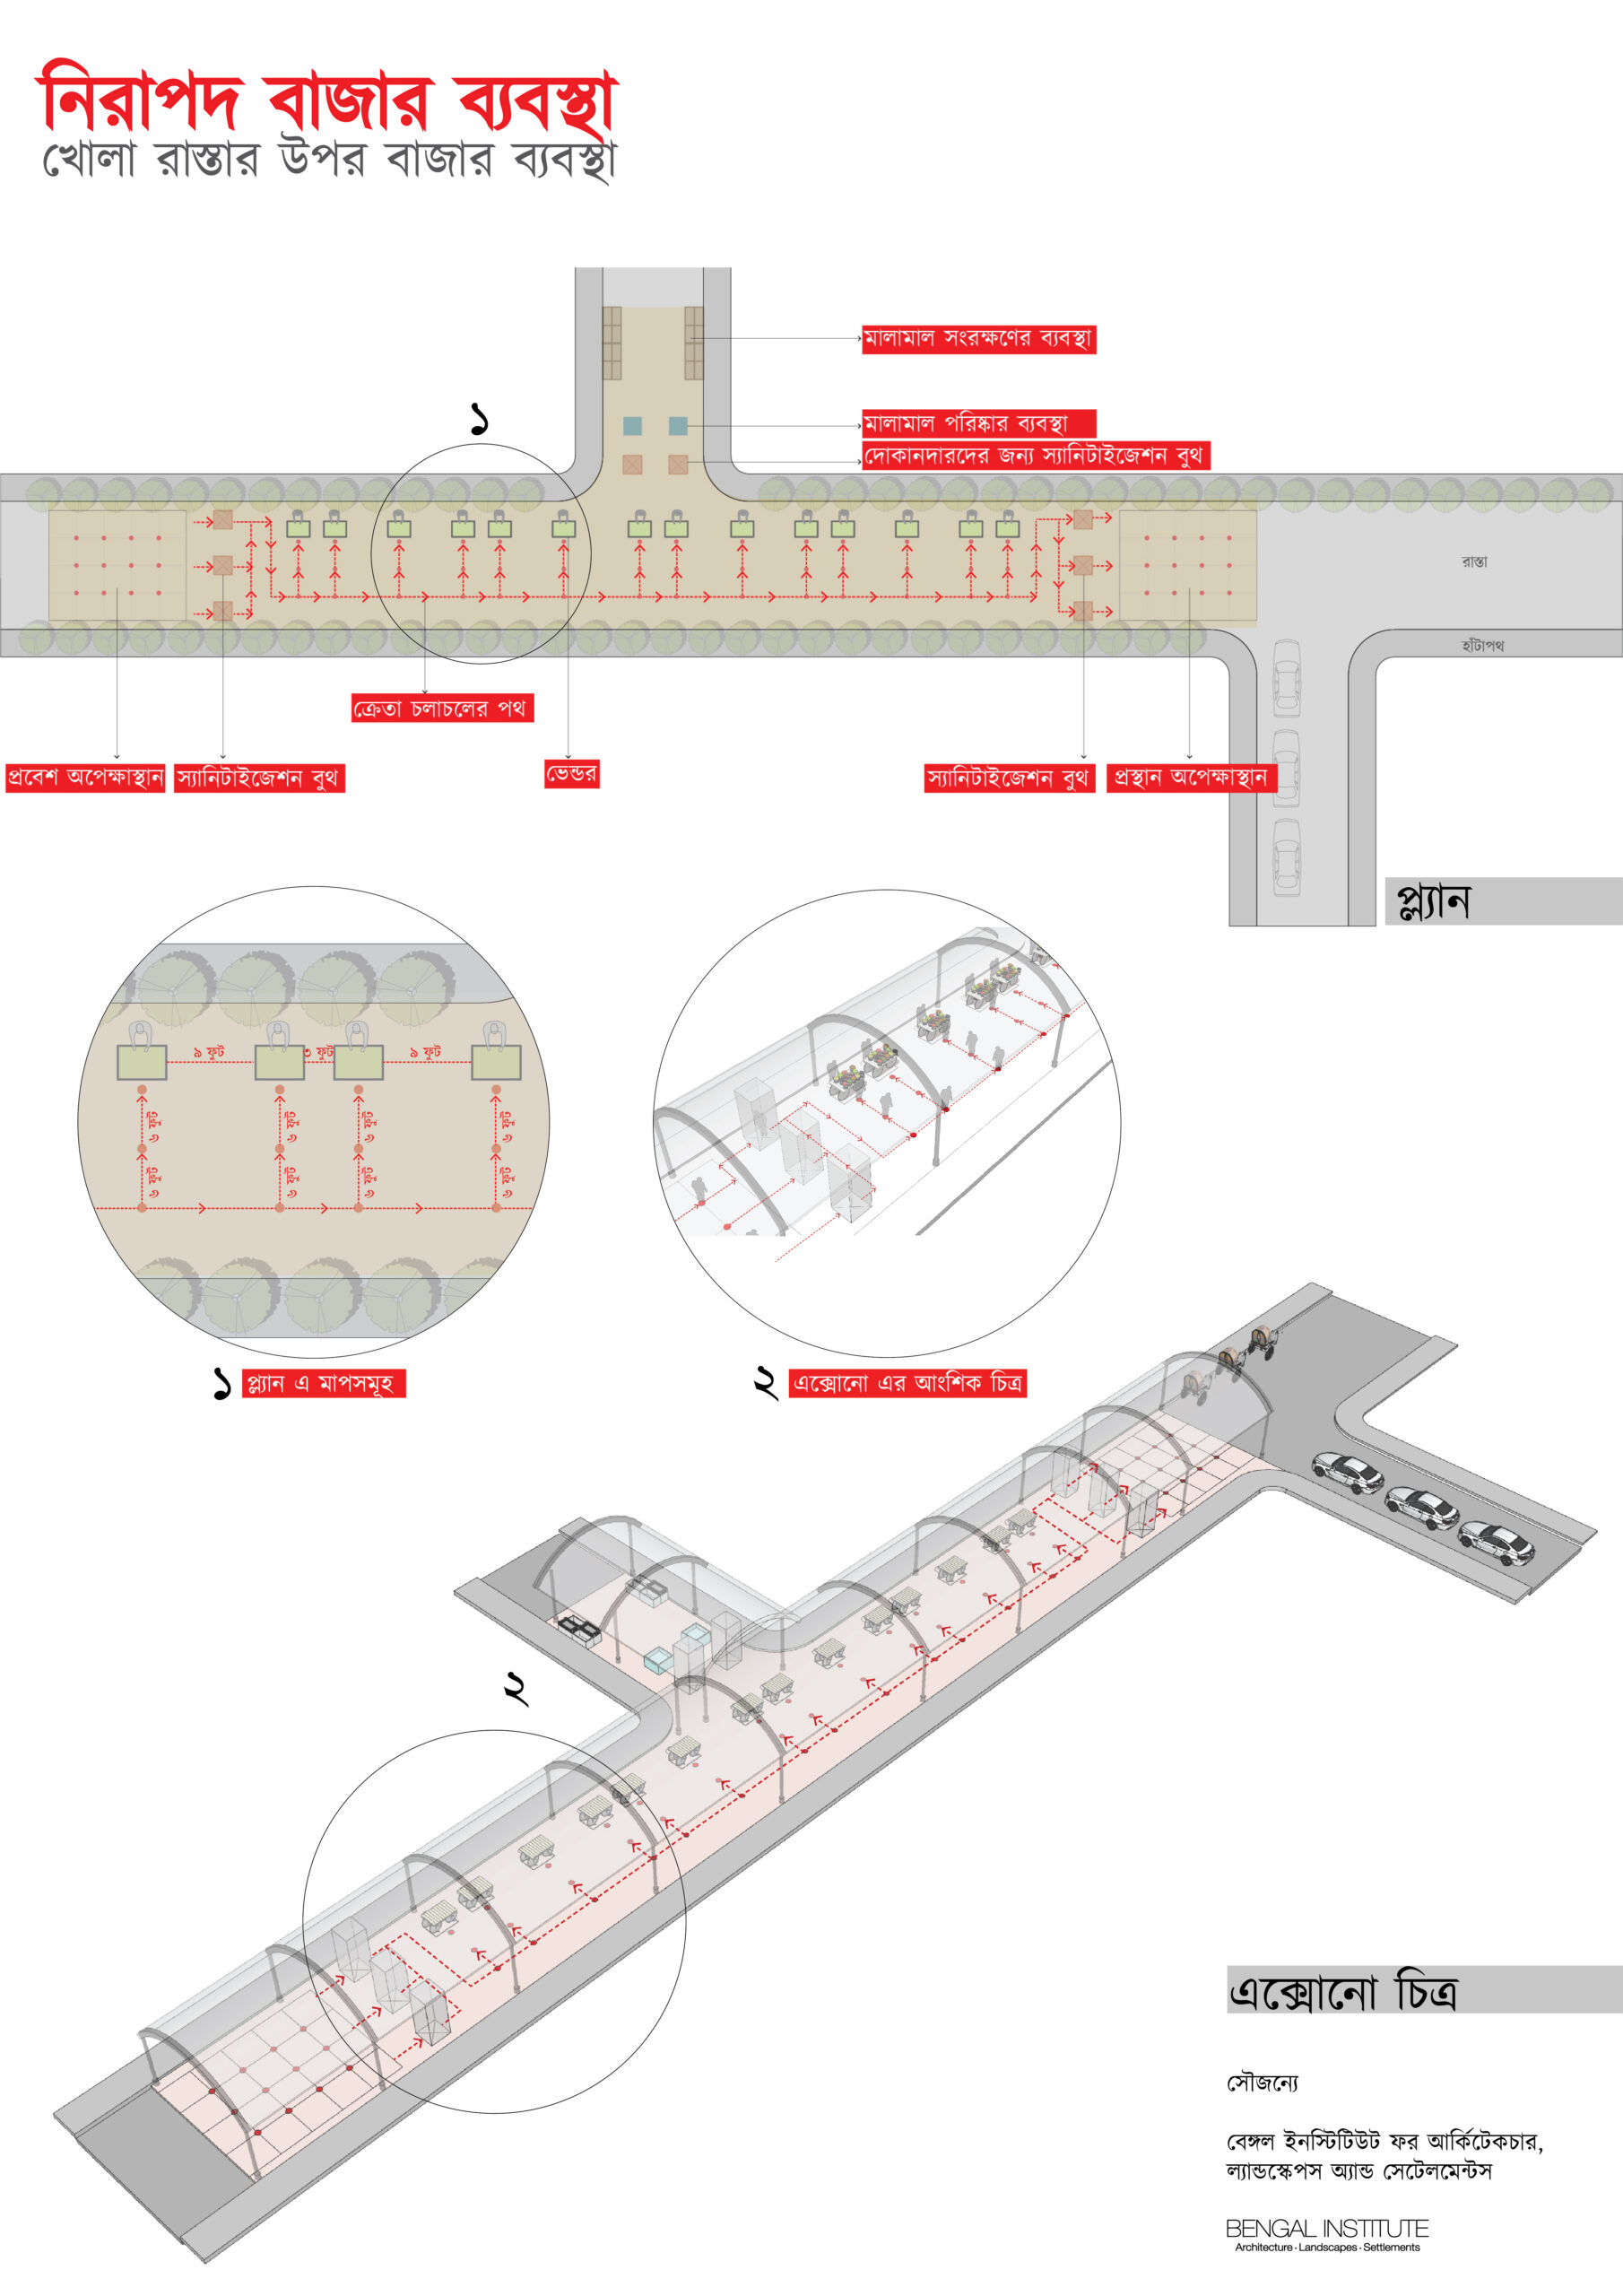
Figure 17: Axonometric view of the safe marketplace
“A lot of the virus had spread from wet markets at Kawran Bazar, so it was crucial to come up with solutions regarding them,” says team member Hassan Mohammad Rakib, who was involved with the plan for converting an open space into a market. “When designing, we prioritised issues like customers maintaining a queue when entering and exiting the market, washing up of the fresh produce and sanitisation of the customers,” he says.
Other facilities of the marketplace include proper ventilation, toilets, cold storage with generator facilities and emergency parking. “A modular system was developed, so that when the market is not in use, it can be dismantled,” says Nusrat Sumaiya.
“I worked on the design of how a road can be transformed to a market, since during a lockdown, roads remain mostly empty or only one side of it is used for vehicular movement,” says Rubaiya Nasrin who had been working on wet marketplaces for a while now. She mentioned that to avoid creating any sort of crowd, the design included waiting spaces before and after the sanitisation device through which customers have to pass through prior to entering and exiting the market. “Vendors use a separate entry, where they enter by using the sanitisation device. There’s also a washing facility for the fresh produce of the market. All of it is to ensure that it doesn’t coincide with the customers’ entry,” she says.
Movement, sanitisation and layout were thus critical considerations for the marketplaces. These markets can be extensions of city corporations markets or special arrangements in various city neighbourhoods. With variations, the arrangements of these safe markets may be applied to any bazaars or outdoor markets.
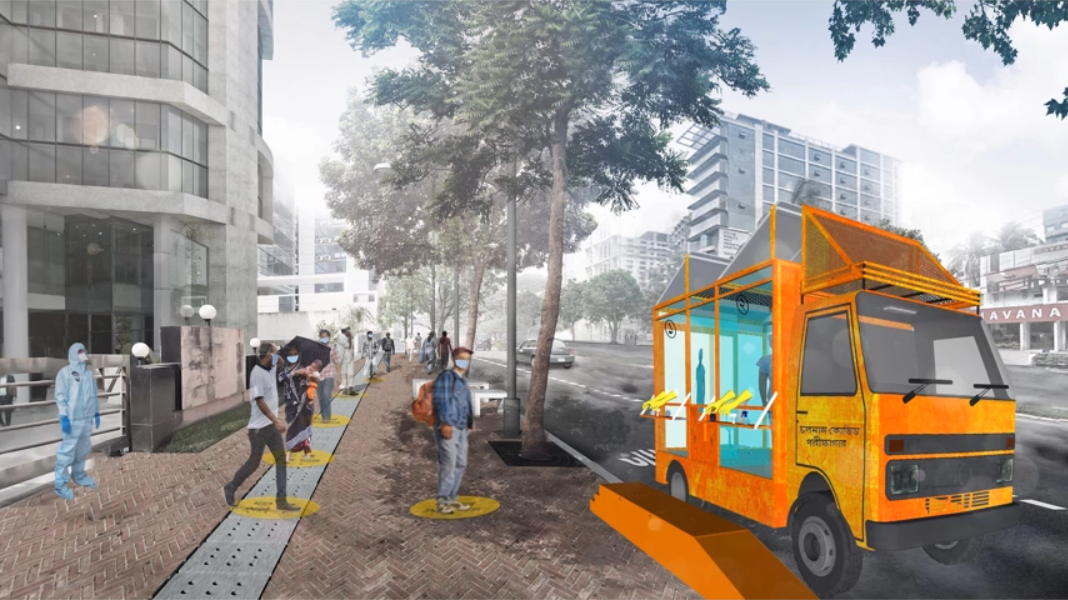
DNCC’s Covid-19 Mobile Testing Booth:
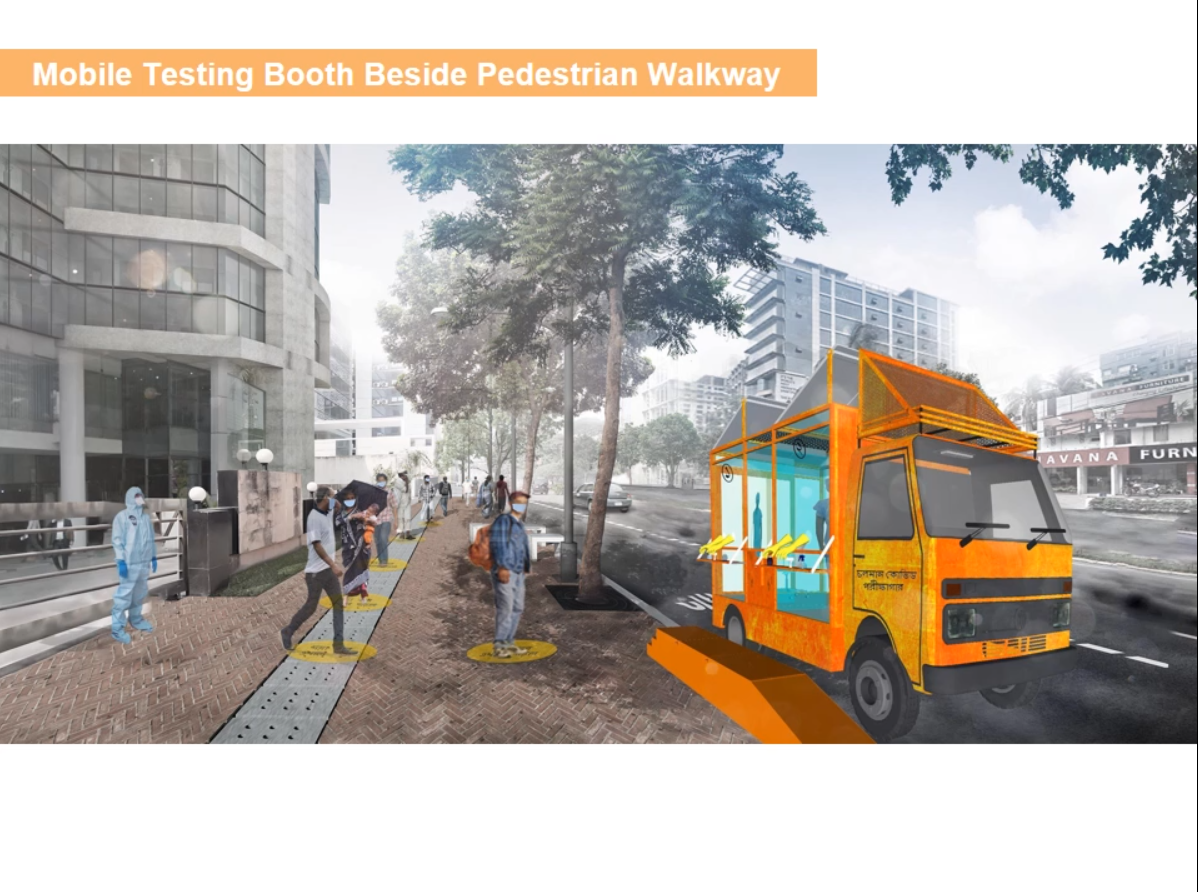 Figure 18: Mobile Testing Booth beside a pedestrian walkway
To manage the control and spread of the coronavirus, tests to determine Covid-19 infection may be one of the most critical aspects of tackling this ongoing pandemic. With no vaccine or drugs available in the market for the general public as of yet, these tests remain the only tool that can paint a picture of how the virus spreads across nations. This is why Bengal Institute, with a team led by Kazi Khaleed Ashraf and Nusrat Sumaiya, designed a mobile testing booth on wheels for the Dhaka North City Corporation (DNCC), which would expand the scope and availability of testing.
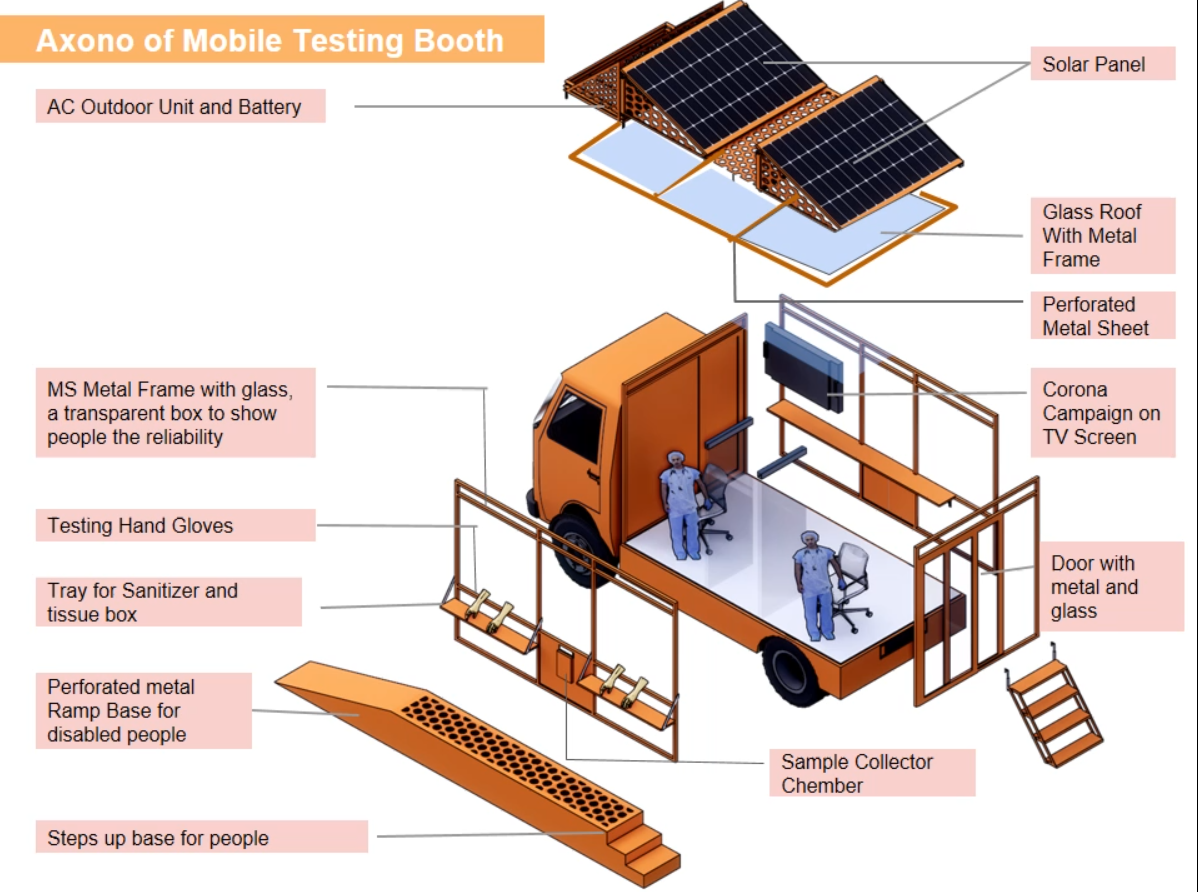
Figure 19: Axonometric view of Mobile Testing Booth
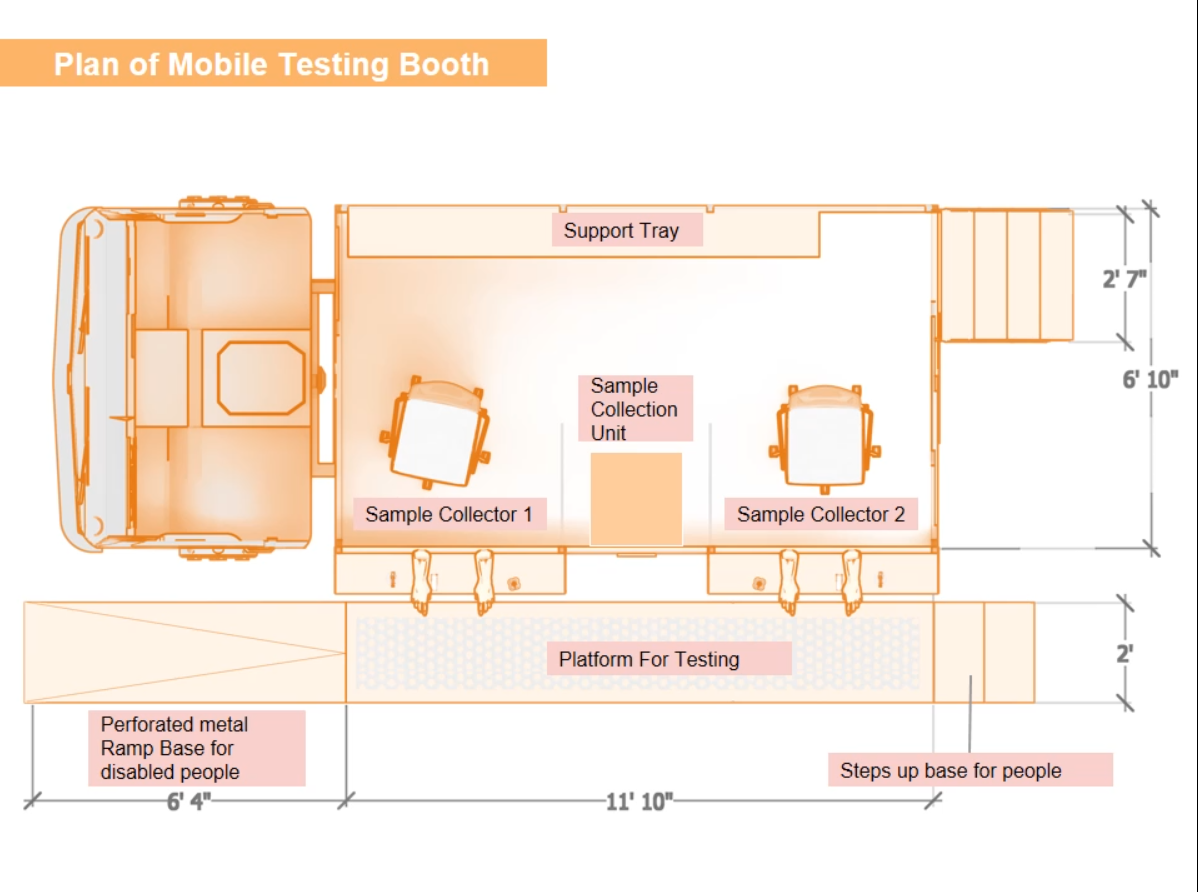
Figure 20: Plan of Mobile Testing Booth
To build the testing booth, team members Nusrat Sumaiya and Sabiha Haque carried out research on existing testing booths and recommendations by healthcare agencies. To make it mobile, the booth was mounted on a pickup truck with distinctive features containing transparent and prominent graphics made by Samira Marzia and Nazmus Sakib. To encourage social distancing for all involved, only two booths were set up in each truck. For the people to stand on during testing, the design proposal recommends use of an elevated platform in the form of a foldable metal deck attached to the truck or an independent unit carried in another vehicle.
The Digital Challenge
One issue with the Covid-19 crisis that differs from pandemics of previous generations is the technical challenges and the digital resiliency that is necessary for it. As governments worldwide imposed lockdowns, online usage surged up significantly with large numbers of people working and studying from home. An increased number of usage of video conferences, video games, online streaming services and greater internet traffic has created a higher demand for global bandwidth. At times like this, publishing dynamically updated visualisations of data and maps related to the pandemic creates a load on the web server.
About 15 to 20 thousand unique visitors visited the Bengal Institute website during June and July, out of which majority of the visitors viewed the pages related to Covid-19 responses. A simple Google Search query like “Covid Dhaka map” serves Bengal Institute pages as the top search result. Also BI website pages show up among the top 5 results for “Covid map Bangladesh” search on Google.
“While hundreds and thousands of people flock to these pages for the latest information everyday—anticipating, preparing and handling the surge become crucial,” says Mohammad Tauheed who was involved with putting up all the Covid-19 responses of Bengal Institute online. “We tried to optimise everything and find a balance between clearly readable visuals yet images and maps that do not occupy much space on our visitors’ devices or exhaust the bandwidth,” he says.
But this time of crisis also turned out to be an opportunity for hackers to attack. “At the same time, we have seen escalated hacking attacks on our website during the pandemic, which we had to routinely monitor and mitigate with firewalls to keep the crucial and time-sensitive public information afloat,” he says.
Inaccurate and misleading information can create confusion and slow down ongoing response efforts. That is why correctness and effectiveness of public communications is another important aspect of Covid-19 related data, articles, awareness campaigns. “More often than now, we have seen how scientific information trickles down to sensationalised fake news. We tried to carefully check every word and sentence that got published recently to avoid something like that from happening,” says Mohammad Tauheed.
Given the nature of the coronavirus, it is hard to predict when, how or if it will end. According to the WHO, the coronavirus may never go away. Like HIV, we may have to accept it as yet another endemic virus in our communities. However, the WHO also claims that it is upto us to keep the virus in control. Director-General Tedros Adhanom Ghebreyesus says, “The trajectory is in our hands, and it’s everybody’s business, and we should all contribute to stop this pandemic.”[3]
Originally published on 4th January, 2021 on Architecture Asia
Written by: Farhat Afzal
References:
